We used BlazeMeter to evaluate our site's capability to handle load.
I set up a simple script that logs in (using a special page which ensures each load test user has a different account), visits several pages along a common route, and ends with generating and downloading a PDF report. These reports are generated on-the-fly and the download can take a bit to get going.
The result of a load test with 1,000 concurrent users (reached at 10:13 on the following graph) are as follows:
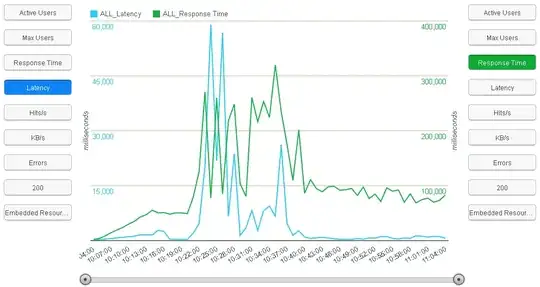
As we expected, there was an increase in response time as the number of users increased and an increase in latency that corresponded. After 10:13, there were consistently 1,000 users walking the script.
What confuses us is the spike in latency (and correspondingly, response time) around 10:25.
We have run this test multiple times, and all the graphs end up looking similar to this. After a few minutes at 1,000 concurrent users there is a period of higher latency and response time, after which the latency drops like a stone and response time stabilizes.
We've discussed this with our hosting service (which keeps us at 4MB usage typically, but will 'burst' us to 100MB during times of high usage) and they are unable to explain it. Our initial thought was that after a few minutes at higher load, the hosting service was automatically doing something to their network to get us higher priority or faster throughput, which resulted in a few minutes of disruption, then increased performance.
Our host, however, claims that this is not the case. They say we always have the 100MB speed, but going higher than a certain threshold is simply a 'billing event', not something that requires their systems to do anything.
What can cause performance like this?