1

When your server fleet doesn't change a lot in time, like when you're using bare-metal hosting, classic monitoring and metric collection solutions (Nagios, Munin) work well.

But if the number of systems varies a lot in time, and may in fact vary rapidly, classic software is more difficult to setup and use. E.g., trying to make Nagios (monitoring) keep up with a rapidly evolving cloud infrastructure can be cumbersome. Same for Munin (metric collection). It's not just the configuration, but the way the information is conveyed to the user, or displayed, is inadequate for the cloud.

What are some possible alternatives that work well with the cloud? The goals are to collect and display metrics (analog to Munin), and generate alerts when certain metrics go out of bounds or when certain services are unavailable (analog to Nagios), and do everything in a cloud-friendly manner.

Some cloud providers offer monitoring / metric collection as services, but not always, and if you use more than one provider you don't want to become too dependent of just one vendor. So provider-independent solutions are required.

EDIT: I am asking this question in a general fashion - not limited to any given cloud infrastructure (like OpenStack), but in the general case of using arbitrary cloud providers.
Florin Andrei
  • 1,208
  • 1
  • 12
  • 18

3 Answers3

4

For systems that are short-lived or where the infrastructure changes often, I use two different tools to handle monitoring. I added a comment asking which metrics were most important to you, and it seems like you're looking for basic "what happened when?" monitoring stats with some alerting...

As systems and hardware are abstracted more via cloud services and virtualization, some of the traditional monitoring tools are less useful because you may not care about physical hardware resources and health. Application and virtual resources (from the perspective of the VM/instance/container) are what matter.

Both of the examples I give below are entirely hands-off and a default in my environments. Reinforced by Puppet, I can ensure that all systems are capturing and reporting their performance.

Pick #1 - New Relic

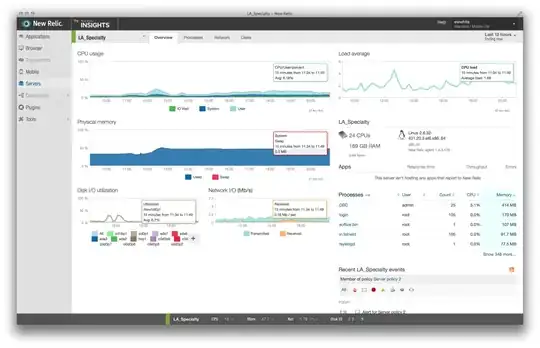
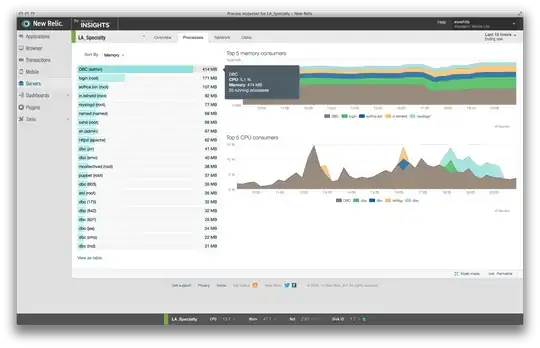
New Relic monitoring is agent based and quite easy to slipstream into a provisioning or configuration management system. In my case, every server I deploy gets a Puppetized New Relic configuration, registers itself with my New Relic account and is available in the monitoring dashboard around ~30-60 seconds from install. The host pushed data over standard ports, so this works well across environments. The system can unregister itself on teardown.

Main positives are 60-second granularity, live dashboard/kiosk view, it's free for server monitoring and is clean and presentable in a manner acceptable to end-users and clients.

enter image description here

enter image description here

enter image description here


Pick #2 - Monit and M/Monit

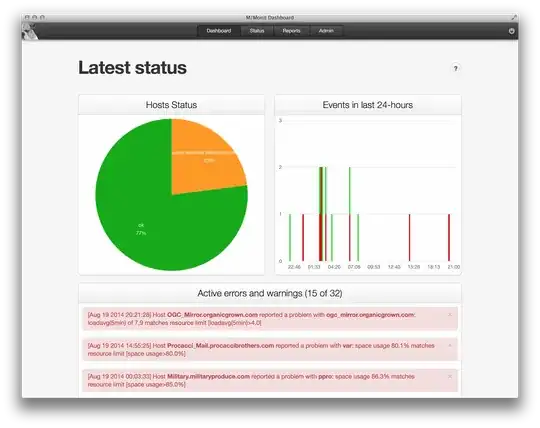
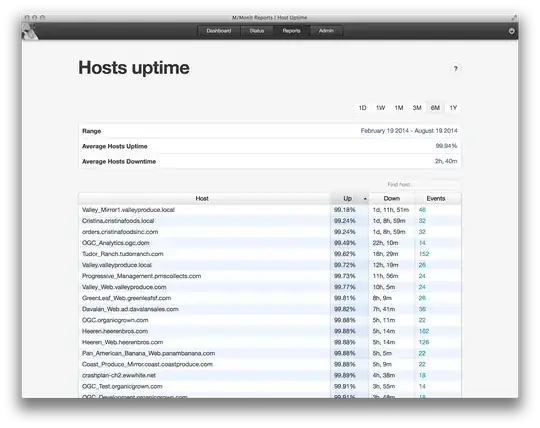
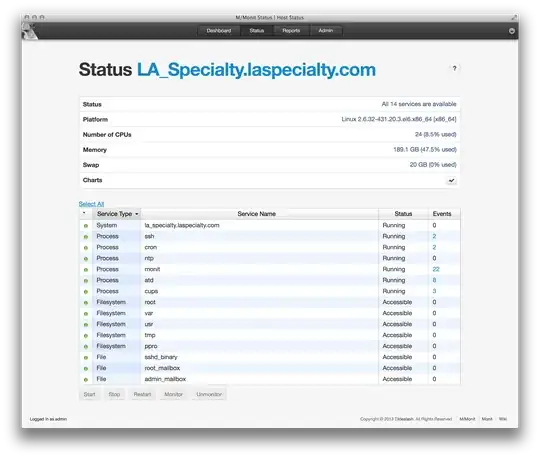
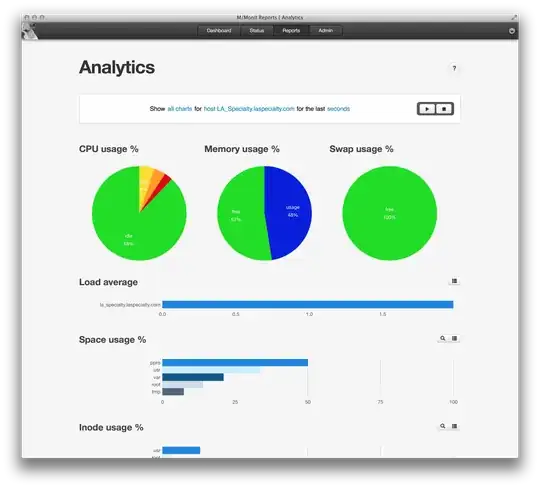
Monit is incredibly handy for application and basic system monitoring. Monit is an agent that is easily installed on target systems via native OS package management. It can be tailored to monitor custom applications and their relevant parameters, as well as taking actions based on those metrics. M/Monit adds a degree of centralization to the Monit checks, and allows you to aggregate data for analysis and light graphing.

Being agent-based, it's also easy to push configs to hosts in an automated fashion. I also use Puppet for this, with some creative tempting to build the confutations files. Upon initialization, new servers will register with the central M/Monit daemon over http/https ports, so firewalls and monitoring of multiple locations is not an issue.

enter image description here

enter image description here

enter image description here

enter image description here

ewwhite
  • 197,159
  • 92
  • 443
  • 809
0

If you're talking about cloud standard software, aka Openstack, the components are well known.

To collect historic data on a cloud scale: https://wiki.openstack.org/wiki/Ceilometer

To monitor - sensu

EDIT:

Ceilometer is openstack specific, but sensu is a generic monitoring framework. Besides, collectd is quite a standard system for gathering metrics, which you can in turn feed into cacti or graphite, to generate trend graphs. For something even more enhanced, you can incorporate a reporting server, like Jasper Reports, but you'll have to do your own CTL. In short, there are plenty of options out there, and this question is indeed too broad to be answered concisely.

dyasny
  • 18,802
  • 6
  • 49
  • 64
0

I'm not actually sure that this is answerable as cloud systems are so diverse (I've actually flagged it as too broad), but my thoughts are below.

As far as system metrics go, you will need an agent on your servers that pushes metrics up to a central collection endpoint to ensure that new servers are automatically added and old servers are either pruned or just stop transmitting metrics when they're terminated.

You can either roll you own (but that also comes with a potential catch-22 about monitoring cloud infrastructure with cloud infrastructure - what happens when Amazon decides to retire your collectd server?), or you can use one of several third-party hosted providers (StackDriver, NewRelic, Boundary, HostedGraphite to name a few - SaaS solutions typically go hand-in-hand with IaaS platforms).

You can of course manage your own Nagios server in your cloud infrastructure, and something like Puppet using exported resources can make this extremely easy - you should at least already be using some kind of automation tool if you're using cloud technologies.

If you're in need of a top-down infrastructure monitoring/alerting platform, both NewRelic and StackDriver have this functionality, at least for the Amazon cloud, and can plug into notification mechanisms like PagerDuty - as yet I'm unaware of a global "one solution to rule them all".

Craig Watson
  • 9,575
  • 3
  • 32
  • 47
  • It may look too broad, but that's exactly the scenario I'm facing - doing things in a provider-independent fashion, as much as possible. – Florin Andrei Aug 20 '14 at 17:38