0

We use Proxmox VE as our virtualization environment, and recently upgraded from 2.X -> 3.X. We also made the change from a single host to a dual host cluster. And, last but not least, we moved our VMs from a LVM backend to a GlusterFS one.

Here is a graph from just before the migration. Notice the clean, clear lines:

Before

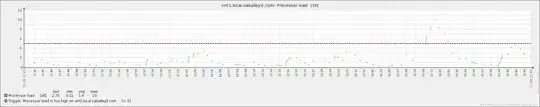
Now, here is the same graph from right now:

After

My first thought was that virt1 wasn't responding quickly, so I used zabbix_get to test that theory, and here's the result:

[root@monit ~]# for i in {1..10}; do (time zabbix_get -s virt1 -k system.cpu.load[,avg1]) 2>&1 | grep -i real | awk '{print $2}'; sleep 1; done
0m0.011s
0m0.015s
0m0.010s
0m0.010s
0m0.010s
0m0.010s
0m0.010s
0m0.011s
0m0.011s
0m0.011s

The result is very quick, and certainly no where near the limit of three whole seconds.

Also, this doesn't happen on all hosts, for example, it happens on virt1, virt2, and a VM called nas, but not on any of the other VMs.

Hopefully, there's a Zabbix guru here who can help.

Thanks!

ETA:

Here are the stats that asaveljevs was talking about:

Timestamp               Value
2014.Aug.14 09:13:56    17
2014.Aug.14 09:13:27    18
2014.Aug.14 09:12:56    17
Soviero
  • 4,366
  • 8
  • 36
  • 60
  • Are there any network errors regarding these hosts in the server log? Also, how busy your pollers are? Zabbix internal process load can be monitored using `zabbix[process,poller,avg,busy]` and other [similar items](https://www.zabbix.com/documentation/2.2/manual/config/items/itemtypes/internal). – asaveljevs Aug 12 '14 at 06:41
  • @asaveljevs I'm running Zabbix 1.8.20, and I don't think those keys exist: `[root@monit ~]# zabbix_get -s localhost -k zabbix[process,poller,avg,busy] | wc -l: 0` – Soviero Aug 12 '14 at 14:26
  • These keys do exist since Zabbix 1.8.5 (see https://www.zabbix.com/documentation/1.8/manual/config/items#internal_checks), but they are not agent checks. Rather, they are of type "Simple check" and are processed by the server itself. – asaveljevs Aug 13 '14 at 06:15
  • @asaveljevs How do you run the checks manually then? – Soviero Aug 13 '14 at 13:21
  • Items of type "Zabbix internal" (the reference to "Simple check" above is a typo) are processed by the server itself and they cannot be run manually, i.e. they cannot be queried using `zabbix_get`. Instead, in Zabbix frontend they should be created on a host monitored by Zabbix server: create an item like you usually do, but select "Type" to be "Zabbix internal" and use "zabbix[process,poller,avg,busy]" as the "Key". – asaveljevs Aug 14 '14 at 10:54
  • @asaveljevs Updated question with your requested information. – Soviero Aug 14 '14 at 14:15
  • In the server log, are there any network errors regarding this host? An example error could be the following: "Zabbix agent item "mysql.ping" on host "sql" failed: first network error, wait for 15 seconds". – asaveljevs Aug 15 '14 at 07:34
  • @asaveljevs I can't believe I forgot Zabbix had a server log! What do you think would cause these errors? http://pastebin.com/3k9jKCTw – Soviero Aug 15 '14 at 23:34
  • @asaveljevs Just to clarify, I'm talking about the network errors for virt2. Not the active check errors, those aren't supposed to work for firewall reasons. – Soviero Aug 16 '14 at 08:28
  • Items "swap.used" and "memory.used", which are complained about in the server log, are not Zabbix built-in items. This suggests that you are probably using user parameters on the agent. Could you please post how they are calculated and how long do they take to process (for instance, by performing the `zabbix_get` loop in the question, but replacing "system.cpu.load[,avg1]" with these keys)? How big is the "Timeout" parameter on the server and how big is it on the agent? – asaveljevs Aug 18 '14 at 08:06
  • @asaveljevs Ok, so I fixed the errors on virt2 by changing the user parameters to use the right awk (/usr/bin/awk vs /bin/awk). However, one host (nas) is still a problem: http://pastebin.com/Ew89gJ7T Any ideas? – Soviero Aug 20 '14 at 14:30
  • What is the value of StartAgents on the "nas" host? Theoretically, if it is low (e.g., 1), it might be running out of listeners. For instance, around "20140819:142858" we can see it being poller by 5 pollers simultaneously. However, the "nas" host only has a couple of network problems every couple of days, on average, so it might be a legitimate network problem. – asaveljevs Aug 21 '14 at 06:54
  • @asaveljevs Interesting... I hadn't noticed that the errors were so far apart. The problem is that the graph for nas is broken similarly to virt2: http://i.imgur.com/vDYNQHy.png Those networking errors don't explain that though. – Soviero Aug 21 '14 at 17:36
  • Could you please post Zabbix log for the period that is shown on the graph? In general, for further troubleshooting help, I might suggest you to refer to Zabbix IRC and forum (see https://www.zabbix.org/wiki/Getting_help). – asaveljevs Aug 22 '14 at 06:50

0 Answers0