I have application is deployed by Elastic Beanstalk. It only connecting to ElasticCache.
I am testing my script capacity using siege utility
siege -c 500 -r 1000 -b myurl
My summary:
Transactions: 12671 hits
Availability: 92.45 %
Elapsed time: 414.56 secs
Data transferred: 12.42 MB
Response time: 8.87 secs
Transaction rate: 30.56 trans/sec
Throughput: 0.03 MB/sec
Concurrency: 271.00
Successful transactions: 12671
Failed transactions: 1035
Longest transaction: 92.94
Shortest transaction: 0.35
So my application is not 100% available.
But I watching CloudWatch metrics and I don't see any warnings about it.
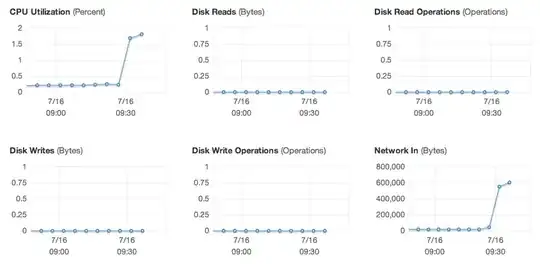
I need to scale my application. But what metrics I should choose?