5

I've looking after some Debian boxes and occasionally I see a big spike in the network traffic. I'm graphing metrics with graphite (being fed by a sensu check which gathers per-interface metrics every minute) and occasionally see this sort of thing:
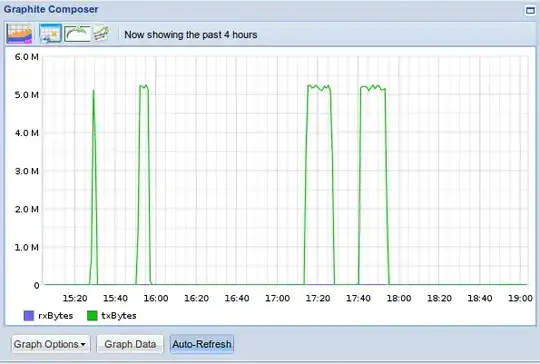
I have no idea what's causing this, as I never manage to catch it while it's in progress. It'd be nice to figure out what's causing this, so what's the best approach to try and figure out what this could be?

I guess what I'm really after is this: Is there a way to audit a network connection (and process id/name) if the amount of data it has sent/received trips over a certain amount or rate?

growse
  • 8,020
  • 13
  • 74
  • 115
  • I don't have an answer for what you're asking exactly, but jnettop is a useful utility showing the current network traffic. – piernov Jul 06 '14 at 19:17
  • What debian version? – Matthew Ife Jul 06 '14 at 20:06
  • I understand that I can use `iftop` and similar tools to find out what's going on *right now*, but I'm not aware of anything that will effectively snapshot the current connection list and activity on each connection over time. Debian version is `wheezy`. – growse Jul 06 '14 at 21:03

2 Answers2

6

You can easily track per-process network statistics using nethogs. There is a precompiled package for Debian.

It works similarly to top:

NetHogs version 0.8.0

  PID USER     PROGRAM                             DEV        SENT        RECEIVED
11951 dawud    /usr/lib64/firefox/firefox          p5p1       4.682       5.502 KB/sec
1145  tomcat   java                                p5p1       0.313       0.560 KB/sec
12411 dawud    /usr/lib64/firefox/plugin-container p5p1       0.027       0.013 KB/sec

TOTAL                                                         5.022       6.075 KB/sec

Check its manpage for further options.

dawud
  • 15,096
  • 3
  • 42
  • 61
  • This looks useful. I can run this in a screen session and then return at a later date. I'll give it a go and see if I can capture the output in graphite somehow. – growse Jul 06 '14 at 21:38
2

I would modify your sensu (nagios?) plugin to run a ps or top command and dump the output to a local file. Then go back and correlate your spikes to the ps/top output to figure out what is going on.

If you don't want to or can't do the change, look at sar or atop.

EDIT: Next idea, run tcpdump then review the traffic in wireshark.

dmourati
  • 25,540
  • 2
  • 42
  • 72