12

I have an HP ProLiant DL380 G7 system using 2 6-core CPUs, with Hyper-threading enabled, for a total of 24 logical CPUs (as seen by Windows).

When running our application, total system CPU utilization is good, but one of the 24 CUPs is pegged at 100%: enter image description here

Edit: This is the PerfMon data for the System process during this time, and for the Processor with the high utilization: enter image description here

Is this normal? If not, is there a way to identify which process(es) are using that logical CPU? Windows PerfMon, ResMon, Task Manager, and Process Explorer have been no help, other than identifying that the CPU is at 100%.

Patrick Cuff
  • 335
  • 1
  • 3
  • 10
  • 29
    My guess would be that it's in use because a process is using it. – HopelessN00b Apr 09 '14 at 15:38
  • 1
    You know you can hover over the graph and get a hint telling you what process is taking the most cpu on that processor?! – Lieven Keersmaekers Apr 09 '14 at 20:05
  • I would be suspicious of the 100k interrupt delta. You should post a Process Explorer process list screenshot where we can see what it says for things like System, DPCs, Interrupts. – Gabe Apr 09 '14 at 21:32
  • @RyanRies; our "application" consists of several .Net WCF services that also WebSphere MQ and some 3rd party monitoring software. – Patrick Cuff Apr 10 '14 at 02:12
  • @LievenKeersmaekers; I noticed that, but according to the PE help, "Note that the mouse tooltips for a processor graph show the name of the process that consumed the most CPU on the entire system at the associated time, not the process that consumed the most CPU on the particular CPU." – Patrick Cuff Apr 10 '14 at 02:20
  • @PatrickCuff - heh, I never noticed. It seems you are right about the process part. The hint however does show the correct % cpu of the overall most consuming process at that timeinterval so if you hover over your CPU and it's showing 100%, I believe you are still good. – Lieven Keersmaekers Apr 10 '14 at 09:54
  • On an older version of windows I used [RATT](https://www.microsoft.com/whdc/Devtools/tools/ratteula.mspx) to figure out which driver consumed CPU time. Not sure if it still works or has any successors. – CodesInChaos Apr 10 '14 at 10:55
  • 2
    It's relatively expensive to move a process from one CPU to another, compared to keeping it scheduled on the same CPU, so if a process is really demanding the CPU then the OS is quite often going to prefer not to move it. – Michael Hampton Apr 10 '14 at 12:04

4 Answers4

23

Show the "CPU Time" column on the "Details" tab in "Task Manager" and look for a process with a CPU time count that's steadily increasing. That's your wedged process. It should be using around 4.17% CPU constantly.

Evan Anderson
  • 141,881
  • 20
  • 196
  • 331
11

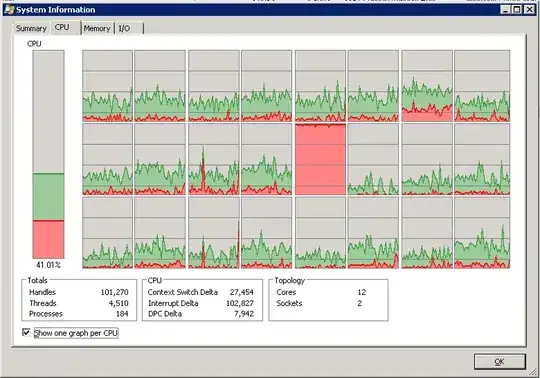
As others have already pointed out, we can see from that screenshot that the CPU that's working so hard is spending all its time in kernel mode. (The red color.)

Running Powershell as administrator, type:

Get-Process | Select Name, PrivilegedProcessorTime | `
Sort-Object PrivilegedProcessorTime -Descending

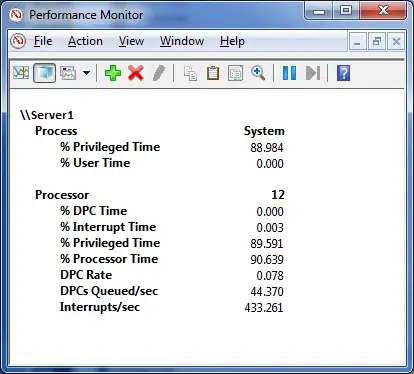
The process at the top of the list is the process currently using the most kernel mode CPU time right now. If that process is not "System," then you've just figured out what user mode process is causing this CPU usage. If the process with the highest Privileged Processor Time is System, which I suspect it is, then it's a little more complicated.

Open Process Explorer. Optionally, set up your symbol server. Make sure you are running with full UAC elevation. Right click the System "process" and go to Properties. Then go to the Threads tab. Sort the threads by CPU usage. The thread that's causing all this kernel mode work should be here. If you look at the module listed under Start Address, it should give you a clue as to what the work is related to. If it's NDIS.sys, for instance, that's a network interface driver. If you set up the symbol server, you should see the name of a function within a module (unless the module is non-Microsoft,) else you'll just see a numerical offset from the module's start address.

Alternatively, use Xperf from the Windows Performance Toolkit to profile interrupts, DPCs, etc.

xperf -on PROC_THREAD+LOADER+DPC+INTERRUPT

and stop recording with xperf -d logfile.etl

Xperf replaces the old Kernrate tool, and can net you some extremely detailed data.

When a CPU is doing work in kernel mode, it's mostly running interrupt service routines. (ISRs) When an interrupt occurs, user mode work is suspended on that processor, and the CPU runs the ISR registered to that interrupt. If you find your CPU spending an inordinate amount of time on these interrupts, that usually indicates a faulty device driver that needs to be updated.

What bugs me (no pun intended) about this scenario though is that it appears as though whatever kernel thread that is doing this seems to be affinitized to that one core. I wonder why the dispatcher seems to be only scheduling the thread to run on that one seemingly arbitrary core. So I have a feeling that we need to find whoever wrote this device driver and show them how to do threaded DPCs, and not to explicitly set an affinity on kernel threads, etc.

Ryan Ries
  • 55,481
  • 10
  • 142
  • 199
  • IIRC, it's quite standard behaviour for an OS to only use a single CPU to handle hardware interrupts... – Massimo Apr 10 '14 at 13:03
  • 1
    @Massimo This might have been the case with old operating systems, but not any more. Every CPU gets its own interrupt descriptor table, and every processor has its own IRQL. If one CPU is stuck at a high IRQL for some reason (i.e. it's already servicing an interrupt,) it can't receive interrupts of same or lower level and so Windows will either give the interrupt to another processor, or just hold on to it until a CPU becomes available. Even timers (an object previously notorious for running only on CPU0) have a processor selection algorithm now. – Ryan Ries Apr 10 '14 at 14:18
  • But yeah, this can be as simple as running a legacy or poorly-written app that is affinitized poorly, and subsequently makes a lot of syscalls. Interrupts usually need to begin and end on the same CPU from which they were called... but normally even a single-threaded app would get "load-balanced" among the cores as it ran... this one seems to have an odd affinity. – Ryan Ries Apr 10 '14 at 14:52
  • @RyanRies; I installed the Windows Performance Toolkit on the system and used the Windows Performance Recorder; the xperf command above kept giving errors. The high CPU looks like it's coming from: Process - System; Module - ntoskrnl.exe; Thread - Phase1Initialize; Function - KeZeroPages. It only happens when the app is running, so I think (hope) I have enough to take back to the developers, but I am also interested in any ideas you may have. – Patrick Cuff Apr 15 '14 at 13:42
10

It seems to be all Kernel time, could be Interrupts, they might only get handled by a single CPU.

MichelZ
  • 11,068
  • 4
  • 32
  • 59
6

Look for a process with a constant CPU utilization of ~4% (= 1/24 of total available CPU). That should be the one continuously taking up a single CPU.

Massimo
  • 70,200
  • 57
  • 200
  • 323