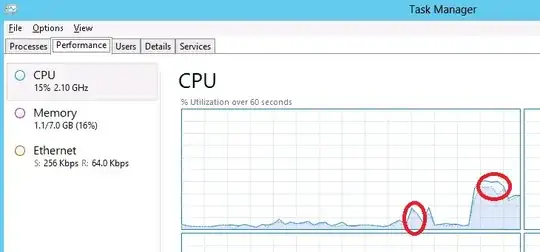
I've searched everywhere for this. What do the 2 different traces on this picture mean? Is one the kernel CPU cycles?
One series is in light blue and the other in dark blue
This is an Azure Virtual Machine seen in Task Manager performance tab as an AMD Opteron Processor 4171 HE