I've a strange problem that's repeatedly troubled me across 3 different servers now.
The problem
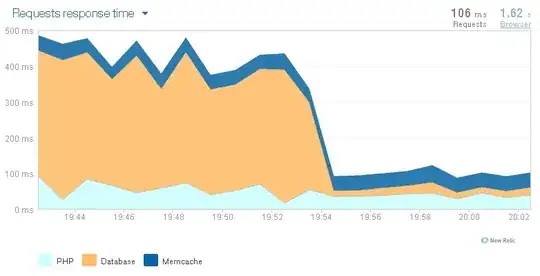
Please see the graph from NewRelic showing the huge amount of time spent in the database.

The hardware;
Originally, I had a powerful but oversubscribed VPS, which is what I put the problem down to. I then moved to a fully dedicated server, which wasn't very powerful (but mine all mine), dual core Athlon, 4GB ram, 250G disk, Ubuntu 13.10, 100Mb/s connection.
I've now moved onto a fully dedicated box with a Xeon E3-1270 V2 3.5GHz, 4 core, 8 logical cores, 16GB DDR3 ram, 1TB disk, Ubuntu 13.10, 1Gb/s connection. The server's load average never exceeds 0.08.
The application
It's a simple, small PHP SMF forum.
The database
...is 20MB in total, 100 tables, mostly InnoDB. It's read-mostly, and all simple queries, getting and setting data, no "work" being done in the DB.
The database is Percona MySQL 5.6; Here's it's config; http://pastebin.com/yYCawtby
Slow query logs are enabled; there are no "slow queries".
If anyone can offer advice on how I might troubleshoot the issue, I'd much appreciate it. Thanks.
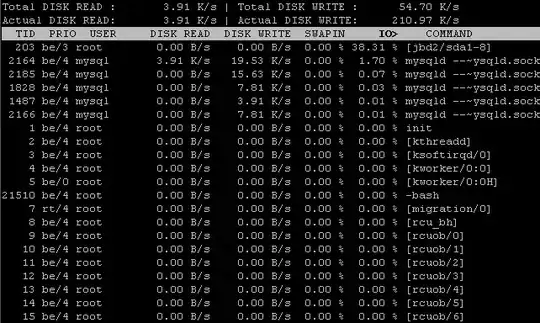
EDIT: IOTop output;
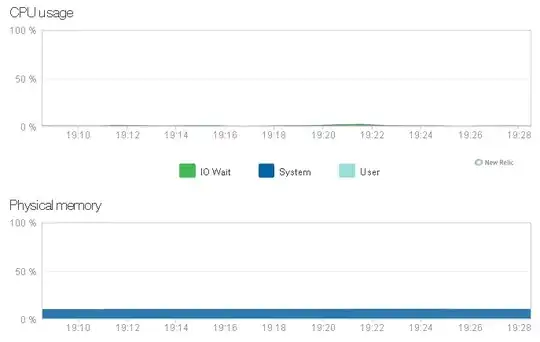
EDIT2: CPU / MEM;
EDIT3: The result;