I've a LAMP stack running Percona MySQL.
Via New Relic, I'm monitoring/tweaking/tuning my new server ready for it to be used live.
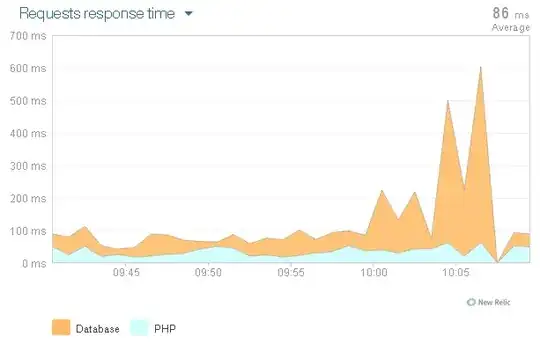
Something that's irritating me though, is that I get periodic (usually after periods of inactivity) where the DB response time (for simple queries that normally respond within a few ms) spike and spoil my averages.
It's as if the cache is being paged, but it isn't. It's got 3GB of ram, hovers at around 512MB consumption and 0 bytes paged.
See graph.
Any idea what could be causing this? It's not as likely to be an issue in production, as there'll be a constant flow of traffic keeping it all alive, but I'd still like to investigate in case there's something afoot.
Thanks.