0

My server get very slow as soon at my gstat output shows high amount of busy%.

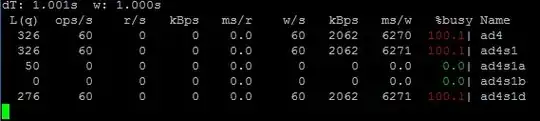
Look at the gstat results:

gstat enter image description here

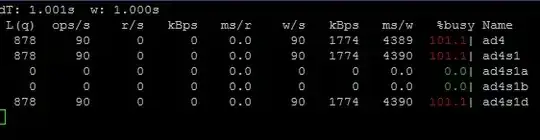
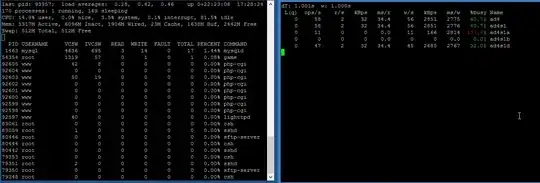
Here is the top -m io -o total and the gstat commands running at the same time:

enter image description here

How can I fix that? Or at least look, which process is flooding my disk?

Server informations:

OVH dedicated server

# uname -a
FreeBSD 8.2-RELEASE FreeBSD 8.2-RELEASE #0: Thu Feb 17 02:41:51 UTC 2011     root@mason.cse.buffalo.edu:/usr/obj/usr/src/sys/GENERIC  amd64
Lucas
  • 163
  • 3
  • 10

1 Answers1

1

The ms/w column in gstat shows that your i/o latency is through the roof. Are you sure that's a dedicated physical server and not a VPS? Your top output suggests that it's mysql (it's the only process with any reads or writes) - I would strongly suspect it's the nature of your queries or size of your db.

Have a look at this: Profiling tools, tips and tricks And this mysql tuning thread - turn on your slow queries log and look at it. You have 6g of ram you're not using at all, you can crank some of the parameters up in my.cnf to give mysql more of that.

You should absolutely have your data and binary logs on separate physical drives if possible (but you only have one drive in there....)

quadruplebucky
  • 5,139
  • 20
  • 23
  • Yes, I am sure its not a VPS (`:-p`) thank you so much for your recommendations. I will give them a try! – Lucas Feb 16 '14 at 17:45
  • 1
    Yould also be a crappy myaql configuration. At the end, though, SSD or a bunch of SAS discs are the solution - there is a limit what you can do with a crappy SATA disc optimized for low price and.... size, not speed. – TomTom Feb 16 '14 at 17:53