2

We have a server with 4 Intel Xeon E5-4617 (6-core) CPUs. We are using it as a database server.

Windows 2012 task manager shows no cpu usage in 2 processors. Process Explorer shows CPU usage in all processors, but low CPU usage in 3 cores from the 4th processor.

Which one is correct?

Edit: Screenshots, using y-cruncher (multi-core Pi generator).

enter image description here enter image description here enter image description here

HopelessN00b
  • 53,795
  • 33
  • 135
  • 209
user208090
  • 21
  • 1
  • 4
  • Well, isn't that something? Those screenshots definitely paint a very different picture that's not going to be explained by polling intervals. Dammit, you went and piqued my interest... and now I think I've got some reading to do. D'oh! – HopelessN00b Feb 06 '14 at 10:02
  • Actually, I can't help but notice the graphs do look pretty similar... unless the last 12 in Task Manager, which appear to be empty. I'm going to suggest that the issue here is that Task Manager is only graphing (and therefore, maybe it's only measuring) 2 out of 4 processors, while System Information is graphing and measuring all 12. That's the problem. Task Manager is only polling CPU #1 and CPU #2, and measuring nothing for CPU #3 and CPU #4. – HopelessN00b Feb 06 '14 at 23:14

2 Answers2

1

Which one is correct?

Both, probably.

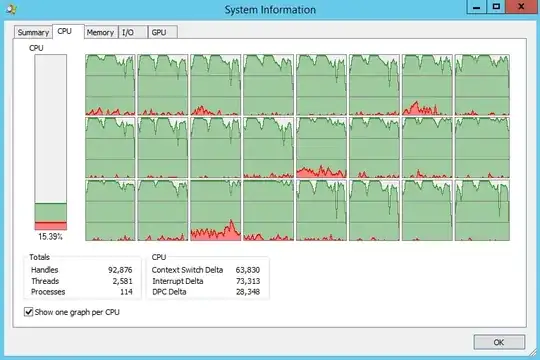
Despite the impression you get from the graphs, resource usage is not polled continuously, but at discrete intervals, instead. So, what's happening here is that at one point in time, Task Manager polls the CPUs for usage, and gets its answer. Some number of milliseconds later, Process Explorer polls the CPU for usage and gets a slightly different answer back.

This makes sense, because it's polling at a slightly different time, and both measurements are probably accurate, just for slightly different intervals. We might not notice a time difference of 10 milliseconds, but it's a long time to computer - a 3.8Ghz processor can process 38 million operations in those 10 milliseconds that we can't even perceive. Here's a somewhat related ServerFault blog post on how polling intervals can lead you to erroneous conclusions.

In fact, it wouldn't surprise me if the the reason that Process Explorer is seeing minor activity that Task Manager isn't, is because Process Explorer is measuring the CPU usage generated by Task Explorer - the polling activity, related calculations and graphing aren't free, and consume CPU resources to process.

So, you've got two things going on here:

  1. You're measuring different intervals of time, which may be imperceptibly small to us, but are actually relatively long periods of time for a computer, in which a lot of activity can occur, generating different, accurate measurements.

  2. Measuring resources consumes resources, which may be detected by which ever application gets it data second. Much like the observer effect in quantum mechanics - the act of observing or measuring an event changes the event - the act of measuring your resource utilization utilizes the same resources you're trying to measure.

HopelessN00b
  • 53,795
  • 33
  • 135
  • 209
  • Thanks for the info but i think it's not what happens to me. I open the Windows Task Manager and Process Explorer separately and Task Manager shows no cpu usage in 12 cores, from processors 3 and 4 with a 35-50% of total CPU usage. While Process Explorer shows very low CPU usage in 3 cores of the fourth processor, also with a 35-50% of total CPU usage. – user208090 Feb 05 '14 at 11:14
  • @user208090 1) Pics might be helpful. 2) So? CPU utilization can jump from 0 to 100 and back down to 0 in a second pretty easily. Like I said, a second is a very long time to a computer. Even a millisecond is pretty long, as an average CPU can process a few million operations in a single millisecond. One millisecond, your CPU might run through a million operations (putting it at ~25% utilization), and a few milliseconds later, it might not have anything to do, and be idling. It happens. – HopelessN00b Feb 05 '14 at 11:14
  • I've added some [screenshots](http://imgur.com/a/FcvlA), using y-cruncher (multi-core Pi generator) to generate high CPU load. – user208090 Feb 06 '14 at 09:30
0

Based on the new screnshots, my answer about the general case is not applicable.

Your problem is that Task Manager isn't running metrics on two of your CPUs/12 of your cores. Those graphs are empty/blank, and not indicating completely idle CPUs. Of course, I'm not sure why it's doing this (even though it clearly gets the number of CPUs right in the text output), or what you'd do to correct it, but that would explain the big difference you're seeing.

So, System Information is correct, since it seems to actually be graphing and measuring CPU usage on all your CPUs and CPU cores.

HopelessN00b
  • 53,795
  • 33
  • 135
  • 209