3

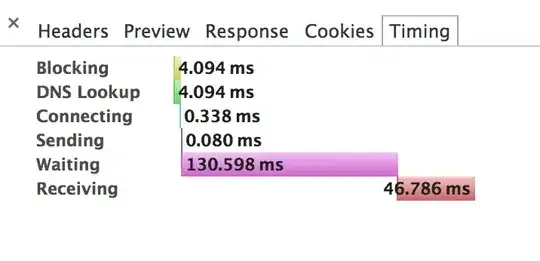
I'm trying to understand why a static image being served by IIS is taking ~ 182 ms to load. Using chrome I captured the following timing information.

Chrome network timing

When I request the same image by opening chrome on the web server directly, I see the "waiting" timing drop to 2-5ms.

I'm trying to make sense of the timing information shown by Chrome. As per Google's documentation, "connecting" timing includes the tcp handshake and "waiting" represents "Time spent waiting for the initial response."

I know for a fact that the web server is not taking more than 2-5 ms to serve the image, so how does my "waiting" number shows ~ 130ms ? Even if it includes the 1 way latency between the server and my browser to transfer the packet, 130ms does not make sense because "connecting" took a total of 0.338ms! These numbers do not add up!

newbie
  • 763
  • 1
  • 10
  • 12
  • As controls, have you done the same test with any of the following: a different image on the same server, or an image on a different server? – charleswj81 Jan 24 '14 at 22:04
  • Is this a consistent delay on every single request of this file? – Mxx Jan 24 '14 at 22:53
  • Have you tried using Firefox's built-in Network Monitor as well (in the Web Developer Console) for your local and remote browser tests? If it exhibits the same behavior, I'd stop digging into the algorithms of Chrome's Network Panel and look at your IIS installation again. – billyw Jan 30 '14 at 00:45

3 Answers3

1

There is much involved. What you probably need are some better detective tools.

  • Download WireShark and learn to use it. It allows you to see your network traffic more clearly. (Not that this is a network traffic issue, but you need to start to eliminate potential problems.) There are a bunch of great videos linked there on how to use it. Here is one that might relate to your issue.

  • Also for http issues download and learn to use Fiddler.

Elliptical view
  • 782
  • 6
  • 9
  • 1
    Not an issue with TCP or a Wireshark question, just trying to understand Chrome timing calculation. – newbie Jan 21 '14 at 18:01
  • Forgot to ask. Are you getting this delay each and every time? Or it happened once / infrequently? – Schien Jan 21 '14 at 22:57
  • I get the delay every time. – newbie Jan 22 '14 at 19:45
  • 1
    Wireshark lets you see the actual time taken between the processed request being sent and the unprocessed reply coming in at network level at the client. Just as a thought experiment and assuming Chromes calculation is perfectly accurate, the difference between that interval and Chromes would be due to processing of the reply further up the network stack and by Chrome itself. Surely that would add half a piece of puzzle (half since Chrome may actually be inaccurate)? Fiddler could possibly add certain timing differentiation further up the stack. Small shards of info which may point somewhere.. – ErikE Jan 23 '14 at 22:08
  • @Nebie, Did you even watch the video that I gave you the link to? – Elliptical view Jan 24 '14 at 00:37
  • I did watch the video, I'm also familiar with wireshark. My question is specifically around chrome, the timings reported by chrome make no sense, do not add up at all. – newbie Jan 24 '14 at 17:05
  • Without getting under the hood of Chrome, and in your specific environment, (which is practically impossible) the best you can do is to look at it's inputs and outputs for clues. Glad you got to watch these. I found them quite interesting. Was very impressed by this woman. A good example I think of how to approach timing problems in a network connected world. So, have you been able to load wireshark and start to get any traces? – Elliptical view Jan 24 '14 at 18:28
1

If you are downloading multiple images from the same domain, Chrome has a limit of 6 parallel connections per domain. What happens, then, is that when the first connection frees up, it'll used to download the next image. In your timing/waterfall chart, you'll see images are downloaded one at a time because of this trickling effect. The "later" images have to wait for a connection to open up. If this is not the case, please post a chart that show 2-3 connections before this particular download. Thanks.

Schien
  • 111
  • 1
  • This is for just 1 image, I'm not dowloading an HTML page but just the image directly in the url – newbie Jan 21 '14 at 18:00
  • When you "opened the image on the web server directly" I suppose you were using "localhost" as the address? This would bypass quite a few network layers. If you use a different machine, even on the same network, you'll notice much longer wait time. I suspect the delay is from IIS's request handling itself. – Schien Jan 21 '14 at 18:08
  • No i did not use localhost in the image url on the server, but the same exact url with the domain name that i use externally. – newbie Jan 21 '14 at 22:43
1

One difference between loading the image on the server and loading it remotely is that IIS wants to look up your remote IP and reverse it. Some of that time might be waiting on a DNS server that isn't local to the webserver to answer.

You can test that if you have access to the IIS server deep enough to put your client test machine's IP into the HOSTS file. You might also, from the server, ping the DNS servers that are configured in the network stack and see if they are about 100ms away.

Mark
  • 2,248
  • 12
  • 15