1

I have an Windows 2003 (don't laugh) server with 10GbE connectivity processing data coming to it over the network and sending it back out.

Here's the graph of overall system performance and the particular application being examined:

sexy graph 1 sexy graph 2

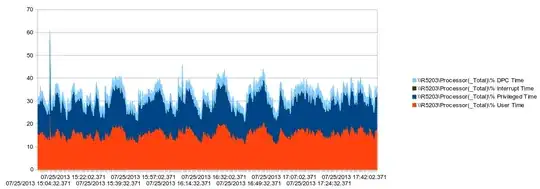
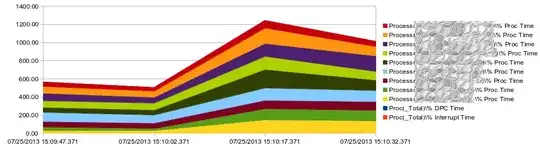
The second graph is zoomed into the momentary spike and is relevant to the data in my answer.

How should I interpret the high percentage of kernel time on these processes? Overall, they're doing a lot of network I/O (66K PPS in, 96K PPS out) and I'm wondering if the correct interpretation is that the time spent in privileged space is copying the data back and forth between buffers and application memory. Would that make sense?

MikeyB
  • 39,291
  • 10
  • 105
  • 189
  • Do you mean a high percentage of kernel time on these *processors*? If so, then it's probably the whole network stack. – David Schwartz Jul 26 '13 at 20:14
  • These process*es*. I don't have the breakdown of user/priv per process but it's these processes accounting for the usage. – MikeyB Jul 26 '13 at 22:06

1 Answers1

0

I've identified LARGE amounts of fragmented packets being handled/generated by this application and suspect that this is the cause of the problem. Awaiting results of further testing. News at 11!

The numbers represent samples taken at regular intervals, corresponding to the graph above. In between the second and third samples traffic going to the application was bumped up by 40k PPS.

Network Interface(BASP Virtual Adapter)\Packets Received/sec
64072   60684  114605  111119

Network Interface(MS TCP Loopback interface)\Packets Received/sec
 9965   10434   20499   17024

IPv4\Datagrams Received/sec
74042   71114  135104  128143

IPv4\Datagrams Received Delivered/sec
65927   64088  107000  102459

IPv4\Fragments Received/sec
10503    9246   32927   29528
MikeyB
  • 39,291
  • 10
  • 105
  • 189