An apartment complex has fiber internet and is experiencing latency problems over the last month.
Tenants frequently experience timeouts and corrupted webpages. The current work around it to refresh the webpage half a dozen times until it loads correctly.
The symptoms are:
- Inconstant, happening a couple times per day per tenant
- Requesting a new dhcp lease on laptop does not solve the issue
Affects both mac and windows machinesUpdate: ONLY AFFECTS MAC USERS!*- Affects both wireless and wired
- Is not a DNS issue because we have tried ISP's dns and google's dns servers with no improvement
- iTunes is heavily affected by this. iTunes store frequently timesout (iPad, iPhone, Mac)
What other diagnostic tools could be used to identify the problem? The ISP says everything looks fine.
A traceroute shows huge latency (several seconds) on hop 9.
traceroute google.com

traceroute: Warning: google.com has multiple addresses; using 74.125.224.168
traceroute to google.com (74.125.224.168), 64 hops max, 52 byte packets
 1  10.90.4.1 (10.90.4.1)  3.086 ms  0.738 ms  0.683 ms
 2  69.169.148.1.provo.static.broadweavenetworks.net (69.169.148.1)  0.907 ms  1.135 ms  0.893 ms
 3  10.8.201.41 (10.8.201.41)  1.040 ms  1.552 ms  11.494 ms
 4  97.75.190.142 (97.75.190.142)  1.343 ms  1.347 ms  0.946 ms
 5  97.75.190.137 (97.75.190.137)  1.290 ms  1.609 ms  1.202 ms
 6  97.75.191.66 (97.75.191.66)  2.463 ms  2.146 ms  2.161 ms
 7  97.75.191.54 (97.75.191.54)  2.406 ms  2.281 ms  2.616 ms
 8  te-9-3.car1.saltlakecity1.level3.net (4.53.40.105)  3.014 ms  2.330 ms  2.241 ms
 9  * * *
10  ae-61-61.csw1.losangeles1.level3.net (4.69.137.2)  15.805 ms
    ae-91-91.csw4.losangeles1.level3.net (4.69.137.14)  15.441 ms  15.160 ms
11  * ae-1-60.edge1.losangeles9.level3.net (4.69.144.10)  17.204 ms  15.983 ms
12  google-inc.edge1.losangeles9.level3.net (4.53.228.6)  92.445 ms  82.679 ms  107.813 ms
13  64.233.174.238 (64.233.174.238)  21.234 ms  21.016 ms  21.321 ms
14  72.14.236.11 (72.14.236.11)  21.577 ms  21.630 ms  21.568 ms
15  lax02s01-in-f8.1e100.net (74.125.224.168)  20.798 ms  20.687 ms  20.666 ms
Affects most webpages (google, apple.com, facebook.com ect..)
(lines 9, 17 and 18 all take a long time).
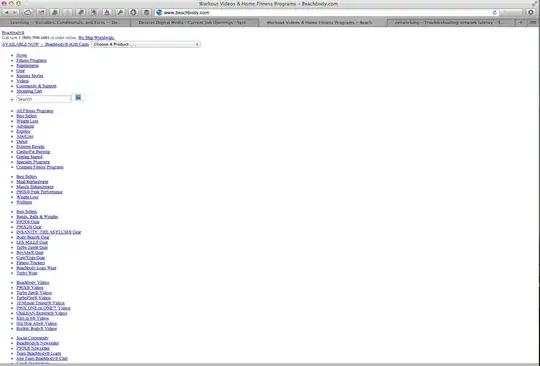
traceroute beachbody.com
traceroute to beachbody.com (66.208.81.68), 64 hops max, 52 byte packets
 1  10.90.4.1 (10.90.4.1)  1.038 ms  0.830 ms  0.767 ms
 2  69.169.148.1.provo.static.broadweavenetworks.net (69.169.148.1)  0.988 ms  0.934 ms  0.928 ms
 3  10.8.201.41 (10.8.201.41)  1.357 ms  1.375 ms  1.500 ms
 4  10.8.101.5 (10.8.101.5)  1.405 ms  1.579 ms  1.115 ms
 5  eth_3-3_prv02-rt02.veracitynetworks.com (97.75.190.166)  10.601 ms  1.563 ms  1.754 ms
 6  97.75.191.66 (97.75.191.66)  2.857 ms  13.554 ms  2.833 ms
 7  97.75.191.54 (97.75.191.54)  2.760 ms  2.394 ms  4.350 ms
 8  te-9-3.car1.saltlakecity1.level3.net (4.53.40.105)  2.352 ms  2.311 ms  2.340 ms
 9  * * *
10  ae-61-61.csw1.losangeles1.level3.net (4.69.137.2)  29.086 ms
    ae-71-71.csw2.losangeles1.level3.net (4.69.137.6)  28.958 ms
    ae-91-91.csw4.losangeles1.level3.net (4.69.137.14)  28.863 ms
11  ae-82-82.ebr2.losangeles1.level3.net (4.69.137.25)  28.075 ms
    ae-72-72.ebr2.losangeles1.level3.net (4.69.137.21)  28.508 ms
    ae-62-62.ebr2.losangeles1.level3.net (4.69.137.17)  29.029 ms
12  ae-6-6.ebr2.sanjose5.level3.net (4.69.148.202)  28.672 ms  28.586 ms  28.223 ms
13  ae-2-2.ebr2.sanjose1.level3.net (4.69.148.142)  28.426 ms  28.341 ms  29.611 ms
14  ae-4-4.car2.sacramento1.level3.net (4.69.132.157)  28.834 ms  29.236 ms  29.231 ms
15  ragingwire.car2.sacramento1.level3.net (4.53.202.22)  29.339 ms  29.406 ms  29.584 ms
16  resisp-74-221-224-49.smf.ragingwire.net (74.221.224.49)  26.096 ms  25.930 ms  26.575 ms
17  * 204.212.188.26 (204.212.188.26)  28.459 ms !X *
18  204.212.188.26 (204.212.188.26)  25.650 ms !X *  26.197 ms !X
Update 1
Here is a traceroute with the same laptop, but different network location (sanitized).
beachbody.com fails 95% of the time at location 1. beachbody.com succeeds 100% of the time at location 2.
traceroute beachbody.com
traceroute to beachbody.com (66.208.81.68), 64 hops max, 52 byte packets
 1  foo.acme (y.y.y.y)  1.716 ms  13.343 ms  6.139 ms
 2  x.x.x.x (x.x.x.x)  74.524 ms  158.532 ms  6.721 ms
 3  tg9-2.cr01.slkcutxd.integra.net (209.63.98.37)  33.225 ms  24.794 ms  24.587 ms
 4  * be4.sc01.sntdcabl.integra.net (209.63.82.166)  32.474 ms  36.895 ms
 5  be1.br02.plalca01.integra.net (209.63.100.118)  24.120 ms  22.298 ms  22.176 ms
 6  peer-02.palo.twtelecom.net (198.32.175.111)  21.401 ms  22.576 ms  21.492 ms
 7  oak1-ar1-xe-0-1-0-0.us.twtelecom.net (206.222.120.214)  23.042 ms  22.441 ms  48.562 ms
 8  74.202.6.2 (74.202.6.2)  29.358 ms  32.253 ms  30.283 ms
 9  204.212.188.26 (204.212.188.26)  25.949 ms !X  30.199 ms !X *
Update 2
Further investigation reveals that this only affects Mac Users!
2nd phone call with Veracity confirms that unusually high percentage of mac users have been reporting problems with iTunes. Level 3 techs have no idea what is causing this.
Update 3
Captured event in wireshark on 2 computers at the same time
Mac (has issue)
http://cl.ly/0o1D2r0K1s2s
Filter = "ip.dst==e3570.b.akamaiedge.net"
Windows (problem doesn't affect windows pc's)
http://cl.ly/3v3e1s2M1W27
Filer = "ip.dst==e3570.b.akamaiedge.net"
Ctrl + F "beachbody"
I don't know why the source/destination is ip.dst==e3570.b.akamaiedge.net and not "beachbody.com" or 66.208.81.68 (the beach body website ip)