I have a scenario with a rather large database. It is about 3GB and I'm hitting some walls with system resources. For example, here is an example of htop output:
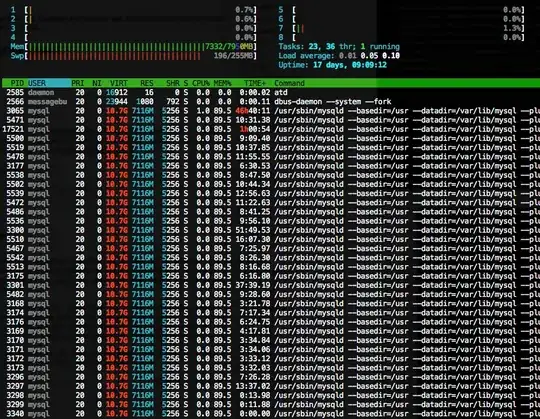
You can observe that there are a lot of unutilized threads here, however I am seeing in the mysqlreport output that we are having a couple of problems specifically in the number of connections 101.11% used (91 out of 90) and the size of the InnoDB Buffer Pool 99.65% used:
MySQL 5.5.30-30.2-log    uptime 17 7:43:49      Thu May 23 21:18:30 2013

__ Key _________________________________________________________________
Buffer used     4.69M of 384.00M  %Used:   1.22
  Current      76.39M            %Usage:  19.89
Write hit      93.73%
Read hit       99.89%

__ Questions ___________________________________________________________
Total         209.84M   140.2/s
  QC Hits     158.88M   106.2/s  %Total:  75.71
  DMS          43.01M    28.7/s           20.50
  Com_          7.34M     4.9/s            3.50
  COM_QUIT    610.81k     0.4/s            0.29
  -Unknown      3.32k     0.0/s            0.00
Slow 10 s       1.11M     0.7/s            0.53  %DMS:   2.58  Log:  ON
DMS            43.01M    28.7/s           20.50
  SELECT       35.75M    23.9/s           17.04         83.12
  INSERT        4.16M     2.8/s            1.98          9.67
  UPDATE        2.62M     1.8/s            1.25          6.10
  DELETE      482.21k     0.3/s            0.23          1.12
  REPLACE           0       0/s            0.00          0.00
Com_            7.34M     4.9/s            3.50
  begin         2.48M     1.7/s            1.18
  commit        2.48M     1.7/s            1.18
  set_option    1.22M     0.8/s            0.58

__ SELECT and Sort _____________________________________________________
Scan            2.07M     1.4/s %SELECT:   5.79
Range           1.02M     0.7/s            2.85
Full join      66.72k     0.0/s            0.19
Range check         0       0/s            0.00
Full rng join  16.58k     0.0/s            0.05
Sort scan       1.33M     0.9/s
Sort range    775.90k     0.5/s
Sort mrg pass   5.54k     0.0/s

__ Query Cache _________________________________________________________
Memory usage   44.45M of 128.00M  %Used:  34.73
Block Fragmnt  14.39%
Hits          158.88M   106.2/s
Inserts        32.44M    21.7/s
Insrt:Prune    8.58:1    19.2/s
Hit:Insert     4.90:1

__ Table Locks _________________________________________________________
Waited          1.55k     0.0/s  %Total:   0.00
Immediate      77.82M    52.0/s

__ Tables ______________________________________________________________
Open             1017 of 1024    %Cache:  99.32
Opened         32.31k     0.0/s

__ Connections _________________________________________________________
Max used           91 of   90      %Max: 101.11
Total         610.95k     0.4/s

__ Created Temp ________________________________________________________
Disk table    849.03k     0.6/s
Table           3.27M     2.2/s    Size:  64.0M
File           60.07k     0.0/s

__ Threads _____________________________________________________________
Running             1 of    3
Cached             13 of   16      %Hit:  99.93
Created           418     0.0/s
Slow                0       0/s

__ Aborted _____________________________________________________________
Clients           271     0.0/s
Connects        3.17k     0.0/s

__ Bytes _______________________________________________________________
Sent          654.61G  437.4k/s
Received       74.53G   49.8k/s

__ InnoDB Buffer Pool __________________________________________________
Usage           2.49G of   2.50G  %Used:  99.65
Read hit      100.00%
Pages
  Free            567            %Total:   0.35
  Data        143.48k                     87.57 %Drty:   0.76
  Misc          19796                     12.08
  Latched                                  0.00
Reads          16.95G   11.3k/s
  From file   152.16k     0.1/s            0.00
  Ahead Rnd         0       0/s
  Ahead Sql                 0/s
Writes          1.36G   908.9/s
Flushes        16.35M    10.9/s
Wait Free           0       0/s

__ InnoDB Lock _________________________________________________________
Waits            7986     0.0/s
Current             0
Time acquiring
  Total       5380317 ms
  Average         673 ms
  Max           51648 ms

__ InnoDB Data, Pages, Rows ____________________________________________
Data
  Reads       688.56k     0.5/s
  Writes       23.27M    15.5/s
  fsync         7.03M     4.7/s
  Pending
    Reads           0
    Writes          0
    fsync           0

Pages
  Created     632.93k     0.4/s
  Read        688.43k     0.5/s
  Written      16.35M    10.9/s

Rows
  Deleted      59.09M    39.5/s
  Inserted    132.33M    88.4/s
  Read         10.31G    6.9k/s
  Updated     246.23M   164.5/s
The actual settings in /etc/my.cnf for these two particular items are:
max_connections=250
innodb_buffer_pool_size = 2560M
Obviously for SOME reason connections are being limited to 90 vs the 250 and I am guessing I need to raise the limit for the innodb_buffer_pool_size, however I am not readily seeing the areas to scale back that will give me the RAM to push that up.
This snapshot was not taken during a busy time of the day, yet the system that is dependent on this database is abysmally slow.
Any input as to what MySQL conf settings would yield the necessary fruit for this problem?