10

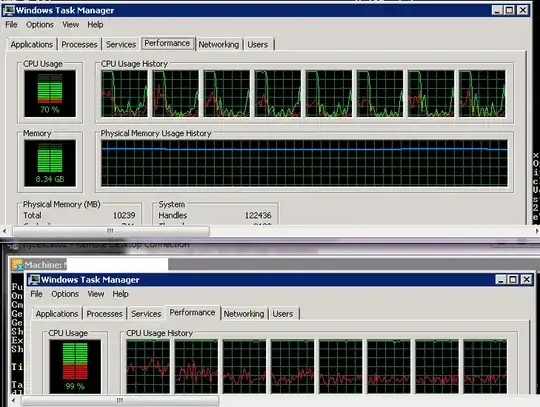
I have unusually high Kernel time on my CPUs as shown in task manager.

What are some ways I can troubleshoot this?

enter image description here

makerofthings7
  • 8,911
  • 34
  • 121
  • 197

4 Answers4

13

The definitive tool for finding out exactly what is using kernel time is kernrate.exe. It comes with the Windows SDK/WDK Visual Studio, etc.

Also Xperf can do the same kernel polling/tracing as well... and is probably a lot easier to use. Kernrate was kind of a beast.

Ryan Ries
  • 55,481
  • 10
  • 142
  • 199
11

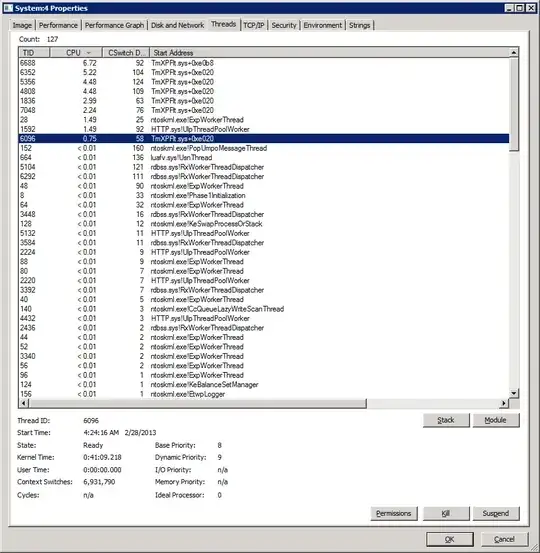
This is probably easier than you think. If you have consistent, high system usage, Process Explorer provides a Threads tab that you can use for the System process (process id: 4). The offending module and function should be displayed.

enter image description here

If you need a formal tool for collecting the empirical data to analyze the issue, you may use the Windows Performance Recorder/Windows Performance Analyzer, part of the Windows Performance Toolkit.

https://blogs.technet.com/b/yongrhee/archive/2012/11/23/installing-the-windows-performance-toolkit-v5-0-wprui-wpr-xperf.aspx

https://blogs.technet.com/b/yongrhee/archive/2012/11/23/wpr-xperf-capture-high-cpu-disk-i-o-file-registry-networking-private-bytes-virtual-bytes-paged-pool-nonpaged-pool-and-or-application-slowness.aspx

mirh
  • 167
  • 7
Greg Askew
  • 35,880
  • 5
  • 54
  • 82
  • 2
    This could be an easy win, but often the real culprit will be hiding behind generic worker threads, in which case this won't tell you much. Even Russinovich resorts to Kernrate in his blog post here: http://blogs.technet.com/b/markrussinovich/archive/2008/04/07/3031251.aspx – Ryan Ries Mar 04 '13 at 17:30
6

I had the issue myself with high kernel times consuming 50% of CPU, while other processes accounted for the remaining 40%. The issue was caused by not properly disabling and uninstalling Trend AV.

Even though the services were stopped, and the realtime scan disabled, kernel mini filters appeared to be enabled. I deduced that they were consuming kernel time after I unstalled the software properly and observed that the kernel time reduced to 1/10th of the previous load.

To view the list of filters on your system, type

C:\Users\TEMP>fltmc filters
Filter Name                     Num Instances    Altitude    Frame
------------------------------  -------------  ------------  -----
TmPreFilter                             3       328500         0
luafv                                   1       135000         0

Microsoft has a list of 3rd party filters available here. According to that spreadsheet, TmPreFilter is Trend Micro, an AV Scanner.

makerofthings7
  • 8,911
  • 34
  • 121
  • 197
  • 5
    Awww I'm really disappointed by this answer. After the [build up](http://meta.serverfault.com/questions/5272/what-are-the-reasons-a-question-can-should-get-an-upvote-or-downvote-on-serverfa#comment8778_5272) I was expecting a beautifully crafted expose on how to troubleshoot high kernel time. Instead you skip all the interesting bits (the how) and present us with one you made earlier :( What steps did you take to get to this conclusion without them you're not really answering the question posed. – user9517 Mar 04 '13 at 15:15
  • @Iain Haha, thanks. My goal here was to share the information that I knew in the SE hybrid blog-wiki format (I don't have a blog or know of a suitable wiki). I really don't know *how* to troubleshoot kernel time, but discovered something that worked and wanted to share it. I can definitely answer questions that are about Email, Security, and some Development. It's a partial answer – makerofthings7 Mar 04 '13 at 15:27
  • 3
    Geat answer, I did not know about fltmc. – jftuga Mar 04 '13 at 19:52
-1

Have a nose using Process Monitor and DiskMon (Microsoft SysInternals) to see what the machine is doing. One common culprit, aside from dodgy device drivers, is good old paging.

Chris S
  • 77,945
  • 11
  • 124
  • 216
Simon Catlin
  • 5,232
  • 3
  • 17
  • 20