Do you have any router/firewall devices in your setup, or are you just connecting from a Linux host? (that makes a difference in your monitoring options)
Also what your committed rate right now versus your burstable rate?
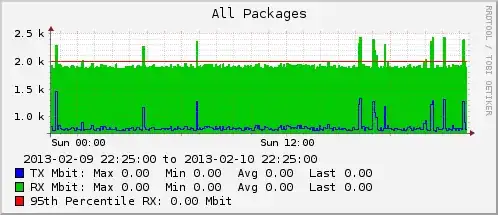
Your provider should provide you a running graph (usually some RRDtool derivative and/or MRTG) displaying your bandwidth utilization throughout the course of the billing cycle. They can measure from your uplink port.
I use Observium on my side, but that's for a larger installation. I'll tap the outside interface of my edge device and monitor 95th-Percentile there. The tool is meant to be used by service providers, so the billing templates are all present.
Something like:
I receive the following breakdown (with a projection) every month from one of my providers...
--------------------------------
Transit : Bandwidth Usage Breakdown
--------------------------------
Last Month Usage Breakdown:

       From: Tue Jan  1 00:00:00 CST 2013
         To: Fri Feb  1 00:00:00 CST 2013

  GBytes     IN =   184.661
  GBytes    OUT =   944.873
          -----------------
          TOTAL =  1129.534

  95th Percentile:  9.866 Mbps

--------------------------------
Month-To-Date Usage Breakdown:

       From: Fri Feb  1 00:00:00 CST 2013
         To: Mon Feb 11 07:33:37 CST 2013

  GBytes     IN =    60.902
  GBytes    OUT =   287.265
          -----------------
          TOTAL =   348.168

  95th Percentile:  9.906 Mbps

--------------------------------
Current Month Projection Usage Breakdown:

       From: Fri Feb  1 00:00:00 CST 2013
         To: Fri Mar  1 00:00:00 CST 2013

  GBytes     IN =    60.902
  GBytes    OUT =   287.265
          -----------------
          TOTAL =   348.168

  95th Percentile:  9.412 Mbps

--------------------------------