1

We periodically get complaints of poor GUI (browser page) response that we need to explore. I am looking for a quick and cheap first check to see if the issue is network latency, or server performance. Has anyone encountered any discussion of ping time and perceived GUI response? I understand that GUI response is complicated, but it would be nice if we could find or develop a rule of thumb along the lines of "Hmmmm, ping is over 200, it might be network problems". Ideally, this lives in a script on the user's machine so that we can see the latency that they are seeing... (BASH, Linux). A reference to a good discussion page would be a fine answer, as would any recommendation of other source material.

10/3: Thanks for all suggestions. While they are useful, and I will explore them, the main thing I was seeking in this query was the quick-and-dirty order-of-magnitude look. For example, I assume that if the ping times are 1 ms, while not definitive, this would suggest that network latency is not the issue, look at the server first; while ping times over 500 ms suggest that I may be looking at an innocent server suffering from problem network service. Quick is the emphasis rather than precise; where should I look first. If my assumption is wrong, that would be very good for me to know!
cvsdave
  • 141
  • 5
  • The problem with using ping as a latency/performance test is that it doesn't give you any information other than "the remote host is responding to my ICMP Echo Request". It won't tell you if the response time is due to network issues or due to the remote host being overloaded, etc. – joeqwerty Sep 28 '12 at 16:09

2 Answers2

3

At least two full round-trips are required over the network to start loading a page, and that's after the DNS lookup occurs, which can sometimes take even longer. So, take your ping times and double them for how they affect a page load.

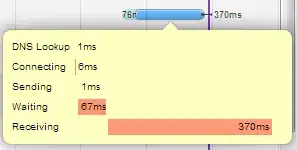
A browser debugging tool like Firebug or Chrome's developer tools will tell you specifically where the time was spent when loading a page, which should give you a much better idea of what's slowing things down. For instance, here's my Chrome dev tools telling me where the time was spent when loading Google's home page:

enter image description here

Shane Madden
  • 114,520
  • 13
  • 181
  • 251
0

Take a look at http://newrelic.com. Sign up for free account and you will get a trial period of pro which should give you good idea of where the b ottle necck is.

The gist is this: The response in GUI (or end user experience known as Apdex score) is a result of several things happening between a browser request and browser finishing the rendering of the page.

I have often found that small things like bad CSS expressions or existence of too many complex nodes in an HTML Docunment has resulted in browser taking forever to render the page. Sometimes its the stupid external javascript like Analytics in non async mode that has blocked the page.

As Shane mentioned tools like Firebug (Firefox) and Chrome Inspection (right click and inspect element then select network tab -> hit refresh) can tell you the first place where the bottle neck is.

If the bottleneck is application, tools like Newrelic can give you a Trace of which calls in the code are slow etc.

Bottomlime: There are many things involved in the process but you have to go by the process of elimination and going for the bigger performance issue first.

Abhishek Dujari
  • 567
  • 2
  • 5
  • 17