1

¿How can I debug this problem?

(I've got full tcpdump captures)

I have a TCP server into which many clients establish persistent connections. Normally all these clients behave, and I never reach the 1024 default Linux limit connections (open files) per process.

Yesterday someone (or something) started misbehaving and leaving a lot of open connections, forcing me to restart the server. You can see its behavior on the following munin netstat graph:

munin netstat connections graph

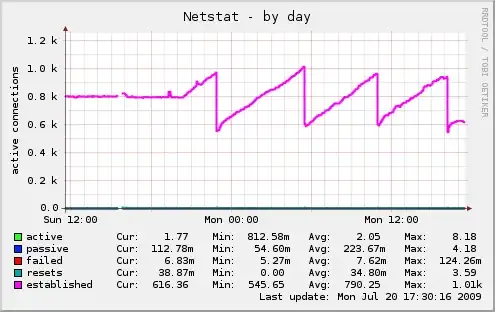
Every time connections reach 1000, I restart the server. Only the fourth time the misbehavior stopped as mysteriously as it started, without any apparent reason. Something similar happened one week ago.

All the bad connections come from the same (sub)network: I can isolate them, but there are some valid connections that come from the same network too (so I can't deny connections from that network).

So far I've used tcpdump, ethereal and ngrep, but I haven't found a way to look at connections that are established, but that don't transfer data.

  • How should I look the tcpdump (pcap) captures to isolate the misbehaving connections and study them?
  • What would you suggest to stop this happening?

Thanks!

Fh.
  • 345
  • 4
  • 9
  • 1
    Have you tried using tcpdump or wireshark filters to list/display solely at TCP frames with both SYN and ACK flags set and IP addresses from the server to clients on the subnet of interest. This would give IP addresses of all connecting devices. If the same device connects every time it may stand out by its quantity of connections, depending on your standard traffic profiles. Does this narrow down the number of devices you need to look at in more detail? – mas Jul 20 '09 at 22:13

2 Answers2

2

In Wireshark, go to Statistics->Conversations->TCP. Try eyeballing the list to see if anything looks odd, e.g. a host with an abnormally large number of connections, low bytes transferred, or a low transfer rate. If you really need to you can copy the data to a spreadsheet. (You can do something similar on the server side using netstat, e.g. on Linux you could run netstat -nt | sort -n -t . -k5,5 -k6,6 -k7,7 -k8,8 to list connections sorted by client IP address).

If the problem is limited to one or two clients, you can look at their traffic to try to narrow the problem down further.

(And if you really are using Ethereal, you should upgrade to Wireshark immediately. Disclosure: I'm the lead developer.)

Gerald Combs
  • 6,441
  • 25
  • 35
  • Oh yes, I should have written "Wireshark" - it's just that the old name is deeply ingrained in my mind :). Thanks! – Fh. Jul 22 '09 at 14:50
1

Protocol analysis is not hard, but it is tedious. The basic process is iterative, with the results from the previous step serving as the input for the next step of the analysis. Basically, you are always comparing what should be happening with what is happening, and noting the anomalies.

I would suggest starting with a raw packet capture with a simple filter to limit the capture to the problem subnets. Depending on the Application Layer Protocol, I would limit capture size to ~100 bytes or so - enough to get the TCP and lower layer protocol headers as well as a little bit of the Application Layer.

Once you know that you have an example of the problem behavior, load the raw packet capture into your protocol analyser of choice - tcpdump, wireshark, Netscout Sniffer, whatever. Now you can start looking for more patterns that allow you to isolate the problem traffic. If you can isolate the traffic, then you can analyse it.

In the comment, mas made a good recommendation for filtering based on SYN/ACK frames and seeing if there are IP addresses which have a large number of open connections.

You can then look at the connections from those IP addresses and count how many sit idle and how many exchange actual data.

Take a look at the data being exchanged. Does the Application Layer Protocol data make sense for your application? Count the number of connections where it makes sense vs. the connections with anomalies.

For some well known problems, Expert Engines have been created that can automate some of this work. In my opinion, this is larger what IDS is, an Expert Engine, or suite of Expert Engines, that automate the analysis of packet captures. You may find a package that does the analysis you need to do. In the meantime, you can start analyzing the data you have.

If all you have is tcpdump, you have to use it, but I prefer the graphical protocol analyzers, exspecially if that have some tabulating or graphing functionality. The GUI helps visual the data, and many conveniently color-code parts of the packet for easier reading.

pcapademic
  • 1,670
  • 1
  • 15
  • 22
  • Thanks EricJLN (and mas too). I'm trying with these filters: (tcp[tcpflags] & tcp-ack) !=0 and (tcp[tcpflags] & tcp-syn)!=0 and net 1.1 - no results (tcp[tcpflags] & tcp-ack) !=0 or (tcp[tcpflags] & tcp-syn)!=0 and net 1.1 - too many results It seems to show every "conversation" while the connection is open, but not each time that a connection opens. Am I doing something wrong? Thanks! – Fh. Jul 20 '09 at 23:11
  • Maybe this could be better: If I only check for the SYN packets I get a list of connections. What CLI instruction can I use to count how many bytes each connection transferred? – Fh. Jul 20 '09 at 23:20
  • When I have a filter that does not seem to quite be working right, I try to simplify it. For example, does (tcp[tcpflags] & tcp-ack) !=0 and (tcp[tcpflags] & tcp-syn)!=0 actually give me all SYN-ACK packets? If no, I'll try to simplify to see all SYN packets. I find it faster to fall back to a provably good state than to spend a lot of time looking for typos. – pcapademic Jul 21 '09 at 18:59
  • The example that is in the man page for tcpdump may be a helpful starting point: To print the start and end packets (the SYN and FIN packets) of each TCP conversation that involves a non-local host. tcpdump ’tcp[tcpflags] & (tcp-syn|tcp-fin) != 0 and not src and dst net localnet’ – mas Jul 21 '09 at 20:10