3

I administer a range of both Windows and Linux servers. On the Windows servers, I have the following performance counters logging every 15 seconds to a CSV file:

Bottleneck analysis:

  • Processor Queue Length
  • Memory: Pages Input/Sec (rate at which pages are read from disk to resolve hard page faults, i.e. when the system has too little physical RAM)
  • Physical Disk: Current Disk Queue Length (For each drive)
  • Network Interfaces: Output Queue Length (for each NIC)

General Activity:

  • % Processor Time (total)
  • Total Working Set (sum for all processes)
  • Memory: Available MBytes
  • Physical Disk: Bytes/sec (for each drive)
  • Network Interface: Total bytes/sec (for each NIC)

I am missing a similar performance log for my Linux servers. I have looked at Sysstat (http://sebastien.godard.pagesperso-orange.fr/) and it seems promising, although rather complex.

If I am to use Sysstat (or something else), how do I set up the Linux equivalent of the above mentioned Windows counters?
ervingsb
  • 395
  • 1
  • 6
  • 16
  • Sorry if this sounds rude, it's not meant to be - but *whyyy* are you doing this? There's lots of far better ways of managing Windows boxes than managing large .CSV files - some of them work quite happily between Windows and Linux too. – Chopper3 Jul 11 '12 at 11:41
  • Why I use CSV? Because this allows me to easily import the data into a database and work with it from other tools. – ervingsb Jul 11 '12 at 11:44
  • Ever looked into using http://munin-monitoring.org/ ? – Creshal Jul 11 '12 at 11:59
  • 1
    I have looked at munin, however, I would really like to have something that just logs these values. I could write a script that collects these data myself, if I know where to get the data. I have found that I can probably get Processor Queue Length from /proc/loadavg and Current Disk Queue Length from /proc/diskstats. But where do I get the equivalent of Memory: Pages Input/sec? And the other values? – ervingsb Jul 11 '12 at 12:09
  • Look at splunk.com – Chopper3 Jul 11 '12 at 13:40
  • How does sysstat not give you want you want? Try running `sar -A` to see all available stats (and take a peek at the manpage for descriptions). You can also plot these using gnuplot pretty easily. Default time resolution is 10 minutes, not 15s, but that's effective for many purposes. If you want more realtime updates, `iostat`, `memstat`, `top`, `htop`, `free`, and/or combinations of commands under `watch` are useful. – Dr. Edward Morbius Jul 12 '12 at 15:38

2 Answers2

2

dstat and collectl are nice tools giving you and overview of the system, but if you wish to get specific information to put into your CSV file, I'd think the easiest way would be to parse the output from the sysstat tools or vmstat, or just parsing the raw data in /proc.

Specifically:

  • Processor queue length: 1-min load average from /proc/loadavg

  • memory pages in/out: si/so columns from vmstat output

  • physical disk: output from iostat -x

  • network interface output queue length: ethtool -g ethN and ifconfig ethN (static values, so probably doesn't make much sense?)

  • % processor time: See e.g. mpstat or per-CPU with "mpstat -P ALL"

  • total working set: See output e.g. from "free" or "vmstat -s"

  • available memory: free or vmstat -s

  • physical disk: See iostat -x

  • nic: ip -s link or netstat -i and calculate, or sar -n DEV

janneb
  • 3,841
  • 19
  • 22
0

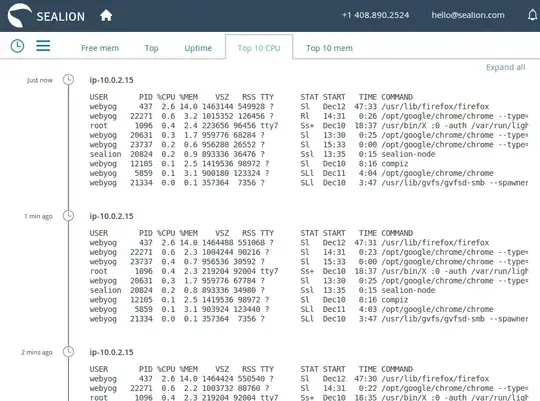
I would like to suggest another free tool called SeaLion. It is a cloud based monitoring tool this that execute some of well know system profiling commands like top, uptime, iostat, vmstat, netstat etc and present in a very beautiful timeline format. The most important point to be noted here is that the installation process is breeze. It set up in no time and data starts to populating in no time. This is good if you have hundreds of servers to monitor.

SeaLion snapshot

stylusbrook
  • 121
  • 1