4

I have been arguing with my ISP about the service they are providing; primarily with regard to throughput speeds.

I have set up an edge router (see hardware details listed below) and on it I have set up the following test to get speeds periodically (via cron):

wget --no-cache --output-document=/dev/null -a /opt/result.txt http://speedtest.wdc01.softlayer.com/downloads/test10.zip

Cacti is set up and configured to ingest the output from this script and present it directly with no apparent modifications. (I'm a cacti newbie.)

Cacti also has graphs configured to show traffic in/out bps for both interfaces and here is where my question lies (lay?) ... Here's where I'm confused:

Earlier the speeds were testing at ~200 Kb/s. Not great.. not dead.

Earlier speed graph.

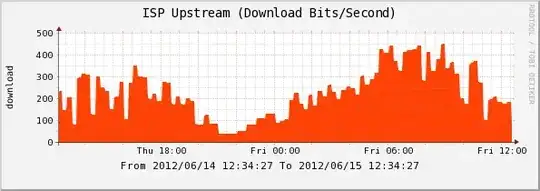
But when I look at the traffic bps inbound (download) it was showing max rates > 1.4 Mb/s.

Later speed graph

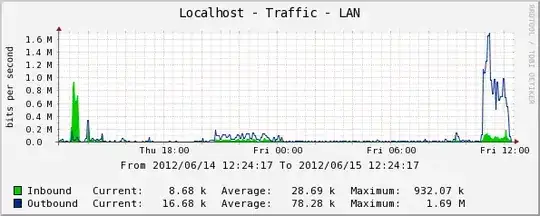
How do I read these two seemingly contradictory pieces of data to make an accurate statement?

Did I misconfigure my reporting graphs somewhere or am I just misunderstanding what I have in front of me?

Hardware --

Dell PRECISION WS340

Linux servername 2.6.18-308.8.1.el5 #1 SMP Tue May 29 14:57:06 EDT 2012 i686 i686 i386 GNU/Linux

# WAN Port
eth0  Link encap:Ethernet  HWaddr 00:06:5B:DD:37:D9  
      inet addr:192.168.100.100  Bcast:192.168.100.255  Mask:255.255.255.0
      inet6 addr: fe80::206:5bff:fedd:37d9/64 Scope:Link
      UP BROADCAST RUNNING MULTICAST  MTU:1500  Metric:1
      RX packets:17738847 errors:0 dropped:0 overruns:0 frame:0
      TX packets:19695910 errors:0 dropped:0 overruns:0 carrier:1
      collisions:0 txqueuelen:1000 
      RX bytes:188062544 (179.3 MiB)  TX bytes:1467340085 (1.3 GiB)
      Interrupt:201 Base address:0xc800 

# LAN Port
eth1  Link encap:Ethernet  HWaddr 00:1A:70:14:0F:40  
      inet addr:192.168.3.1  Bcast:192.168.3.3  Mask:255.255.255.252
      inet6 addr: fe80::21a:70ff:fe14:f40/64 Scope:Link
      UP BROADCAST RUNNING MULTICAST  MTU:1500  Metric:1
      RX packets:17502568 errors:1 dropped:0 overruns:0 frame:1
      TX packets:12613687 errors:22 dropped:0 overruns:0 carrier:22
      collisions:0 txqueuelen:1000 
      RX bytes:1453811807 (1.3 GiB)  TX bytes:31429096 (29.9 MiB)
      Interrupt:193 Base address:0x2c00 
August
  • 3,114
  • 16
  • 17
Lorin S.
  • 95
  • 1
  • 2
  • 10

4 Answers4

3

1.) Pulling a file down with wget doesn't necessarily accurately measure the speed of your connection as it's subject to upstream traffic conditions on whichever of many paths your provider may be using to reach your target host. You're additionally also measuring the performance of the TCP setup on your OS and even the efficiency of wget itself. This sort of test can be useful as a relative value (i.e. it's usually 200kbps but now it's 100 - let's look into it) but is questionable as an absolute.

2.) The way in which Cacti (or similar) are measuring bandwidth from the router is likely somewhat different than the result from wget. Cacti is looking at the amount of data transmitted during its polling intervals and interpolating that into an overall curve while wget is dividing the size of the file by the transfer time. The wget approach represents a single transaction while Cacti is looking at the average bandwidth on the link before, during and after the transfer.

3.) The output from wget is in bytes per second while Cacti is most likely measuring in bits per second. 200 kilobytes per second = 1.6 megabits. Make sure you're comparing equivalent units...

rnxrx
  • 8,143
  • 3
  • 22
  • 31
  • Mislabeled speed graph .. Point #3 is what it was. I labeled it bits but you're right it's actually monitoring in Kb/s. Thanks for the second pair of eyes. Your first two points are very valid also especially considering the different factors that can affect speed. Thanks again. – Lorin S. Jun 15 '12 at 18:30
1

If you are worrying about upload vs download speed differences, ISPs often allow much faster download speeds than upload speeds. You can also try running iperf between an internal and external host to gauge upload/download speeds. It basically maxes out the connection and reports on the throughput over a time period you specify. I've used it in the past to confirm that our ISP was capping us at a hard limit and saw throughput drop off dramatically when we hit the cap.

August
  • 3,114
  • 16
  • 17
1

What is the granularity of your data points? From the two graphs shown, I'd guess there are two things that don't align:

  1. The granularity of the data. It looks like the first graph, titled ISP Upstream, is averaging into 5 minute buckets. It looks like the second graph, titled Localhost - Traffic - Lan has 1 minute buckets, or at least some notion of a high-water mark.

  2. The time of the graphs. It looks like the first graph is in EDT and the second is in UTC, resulting in a 5 hour offset in the data.

Jed Daniels
  • 7,282
  • 2
  • 34
  • 42
0

Just use something easy like http://www.speedtest.net/. It might already be what you Need...

MichelZ
  • 11,068
  • 4
  • 32
  • 59