15

Munin is showing me a graph like this:Munin eth0 graph

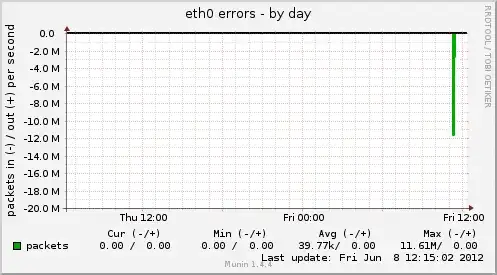
During that spike, I was unable to access my server through the eth0 port (I could access it through my IPMI port).

I'm trying to figure out what happened, but I can't seem to locate any log files for eth0.

I don't see anything in /var/log/(kern|syslog|messages) that is out of the ordinary. And I don't see a log file specifically for eth0.

Are there logs for eth0, and if so, where can I find them?

I am running Ubuntu 10.04 LTS.

Matt
  • 207
  • 1
  • 3
  • 6

1 Answers1

13

There are no logs for your interfaces. If you check soon enough, you can likely find them in the output of dmesg. You should find all that output in /var/log/messages. If it has rotated you need to look in /var/log/message.1.

Grep out the time range to a separate file that you can examine more easily. A command like grep 'Jun 7 22:' /var/log/messages > ~/messages.tmp should work. Look for references to eth0 in the file. You may also see a reference to repeated messages which may be close to the line that indicates the problem. Also look for references to the driver for your interface, or the manufacturer.

Running the command ifconfig eth0 should output error counts, and may give you a hint as to the problem in the counts the follow the errors.

BillThor
  • 27,737
  • 3
  • 37
  • 69
  • 1
    Like I said in my post, that log file didn't have anything out of the ordinary in it. But next time I will try ifconfig eth0. I also installed ethtool, which should be helpful too. – Matt Jun 13 '12 at 22:25
  • 1
    There may have been nothing wrong with your card. Another device on the network can increase your error counts. I have seen faulty switches cause errors for their clients. `ifconfig` helps track down these cases. A temporary duplex mismatch can cause high error rates. – BillThor Jun 14 '12 at 02:45