Summary: if database contains a doc with 32K issue or corrupt, on server to server replication it causes marked increase in CPU in nserver.exe task, which effectively causes our server(s) to slow right down.
We have a 5 server cluster (1 "hub" and 4 HTTP servers accessed via reverse proxy and SSO for load balancing and redundancy). All are physically located next to each other on network, they don't have dedicated network\ ports for cluster or replication. I realise IBM recommendation is dedicated port for cluster. Cluster queues are in tolerance and under heavy application user load, i.e. the maximum number of documents are being created, edited, deleted, the replication times between servers are negligible. Normally, all is well.
Of the servers in the cluster, 1 is considered the "hub", and imitates a PUSH-PULL replication with it's cluster mates every 60mins, so that the replication load is taken by the hub and not cluster mates.
The problem we have: every now and then we get a slow replication time from the hub to a cluster mate, sometimes up to 30mins. This maxes out the nserver.exe task on the "cluster mate" which causes it to respond to http requests very slowly.
In the past, we have found that if a corrupt document is in the DB, it can have this affect, but on those occasions, the server log will show the corrupt doc noteId, we run fixup, all well. But we are not now seeing any record of corrupt docs. What we have noticed is if a doc with the 32K issue is present, the same thing can happen. Our only solution in that case is to run a : fixup mydb.nsf -V, which shows it is purging a 32K doc. Luckily we run a reverse proxy, so we can shut HTTP servers down without users noticing, but users do notice when a server has the problem!
Has anyone else seen this occur?
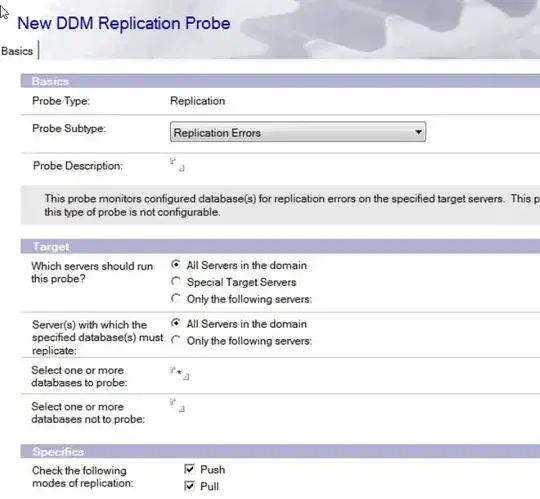
I have set up DDM event handlers for many of the replication events. I have set the replication time out limit to 5 mins (the max we usually see under full user load is 0.1min), to prevent it rep'ing for 30mins as before. This ia a temporary work around.
Does anyone know of a DDM event to trap the 32K issue? we could at least then send alert.
Regarding 32K issue: this prob needs another thread, but we are finding this relatively hard to find the source of the issue as the 32K event is fairly rare. Our app is fairly complex, interacting with various other external web services, with 2 way data transfer. But if we do encounter a 32K doc, we can't look at field properties, so we can't work out which field has issue which would give us a clue as to which process is culprit. As above, we run a fixup -V.
Any help\ comments on this would be gratefully received.