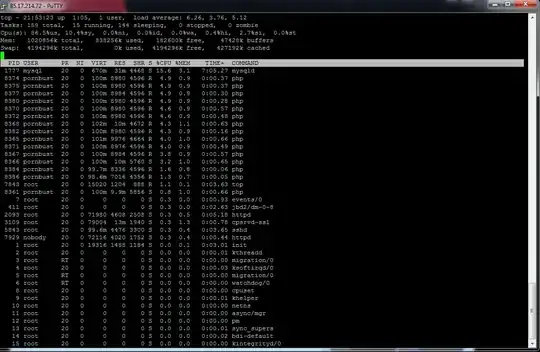
The screencap seems to show a number of php processes, which suggests that you are running php under apache2 as a cgi-script (rather then the php-script module) or that you have standalone processes that are running as php command line, or php interpretor.
The associated mysqld CPU, suggests that they are all doing something MySQL related (or that could be a co-incidence)
That those php are not running as the apache user, suggests that you would need to provide some more information about what those processes are, and why they might suddenly use more resources.
if you want to get some more information about the php process, I use something like this as a one-liner to dump some pid info...
first select a pid number from the top outout, for example 8371 from your output, in this example I am just showing some values from a sleep 10000 that i did as a test...
# pid=17837; { cat /proc/${pid}/{cmdline,environ} && ls -l /proc/${pid}/{cwd,exe}; } | tr '\0' '\n';
sleep
10000
HOSTNAME=workstations01.config
TERM=xterm
SHELL=/bin/bash
HISTSIZE=1000
SSH_CLIENT=123.123.123.123 55069 22
SSH_TTY=/dev/pts/2
USER=userXXX
LS_COLORS=no=00:fi=00:di=00;34:ln=00;36:pi=40;33:so=00;35:bd=40;33;01:cd=40;33;01:or=01;05;37;41:mi=01;05;37;41:ex=00;32:*.cmd=00;32:*.exe=00;32:*.com=00;32:*.btm=00;32:*.bat=00;32:*.sh=00;32:*.csh=00;32:*.tar=00;31:*.tgz=00;31:*.arj=00;31:*.taz=00;31:*.lzh=00;31:*.zip=00;31:*.z=00;31:*.Z=00;31:*.gz=00;31:*.bz2=00;31:*.bz=00;31:*.tz=00;31:*.rpm=00;31:*.cpio=00;31:*.jpg=00;35:*.gif=00;35:*.bmp=00;35:*.xbm=00;35:*.xpm=00;35:*.png=00;35:*.tif=00;35:
SSH_AUTH_SOCK=/tmp/ssh-lGNBN31178/agent.31178
MAIL=/var/spool/mail/userXXX
PATH=/usr/kerberos/bin:/opt/admin/bin:/usr/local/bin:/bin:/usr/bin:/opt/mx/bin
INPUTRC=/etc/inputrc
PWD=/home/userXXX
LANG=en_US.UTF-8
SHLVL=1
HOME=/home/userXXX
LOGNAME=userXXX
SSH_CONNECTION=123.123.123.123 22
LESSOPEN=|/usr/bin/lesspipe.sh %s
G_BROKEN_FILENAMES=1
_=/bin/sleep
lrwxrwxrwx 1 userXXX users 0 May 29 13:11 /proc/17837/cwd -> /home/userXXX
lrwxrwxrwx 1 userXXX users 0 May 29 13:12 /proc/17837/exe -> /bin/sleep
(there are obviously loads of ways to see what the php invocation was. this was just a quick off my head example)