7

We have a Windows 2003 R2 Enterprise 64-bit server running a custom workload suffering from an odd performance problem. The pared-down version below suffers from a smaller hump, but it's qualitatively the same.

We've reduced it down to a simple trivial app doing nothing more than:

  • listening on a socket
  • joining a multicast group
  • listening for packets coming in on that group
  • reading and discarding the packets

The test application itself is a slightly modified version of the Boost ASIO multicast receiver example so there's not really much that ought to be going wrong. Actual code(!) below…

Every so often while running this program under load, the CPU for this process will ramp up with all of the processing happening in kernel code:

perfmon graph 
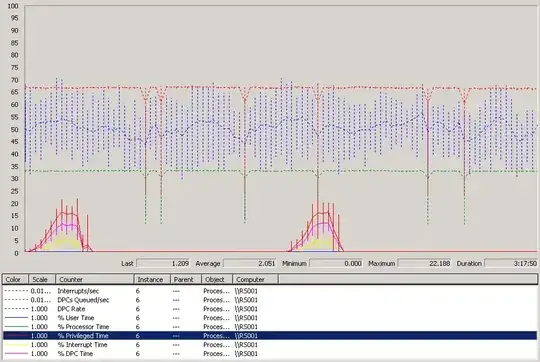
(only CPU 6 is shown here. For the duration of this test (3h17m) all other processors are idle)

As you can see from the graph, when the load spikes hit all of the processing time is happening in kernel code. The time spent is mostly spent in Deferred Procedure Calls (max 16.8%) and handling Interrupts (max 8.5%). It looks like there's some sort of deferred cleanup happening, but we have no idea what it could be.

As far as we can tell it's happening on W2K3E-64 only.

It is happening on different hardware (HS21, HS22, HS22V, HP DL380).

Running the test application on Windows 2008 demonstrates the problem to a much smaller extent (more often but smaller humps).

How can we fix this or where should we look next?


Actual code from the example:

void handle_receive_from(const boost::system::error_code& error,
    size_t bytes_recvd)
{
    if (!error)
    {
        ++m_receivedPackets;
        m_receivedBytes += bytes_recvd;
        m_last64TotalBytes += bytes_recvd;
        if ( ( m_receivedPackets & 0x3F ) == 0 )
        {
            printf( "Received %u bytes in %u packets. The average size of the last 64 packets was %u bytes, and the last byte received was %x.\n", 
                m_receivedBytes, m_receivedPackets, m_last64TotalBytes / 64, m_buffer[ bytes_recvd - 1 ] );
            m_last64TotalBytes = 0;
        }

        m_socket.async_receive_from(
            boost::asio::buffer(m_buffer, max_length), m_senderEndpoint,
            boost::bind(&receiver::handle_receive_from, this,
            boost::asio::placeholders::error,
            boost::asio::placeholders::bytes_transferred));
    }
    else
    {
        std::cerr << "An error occurred when performing an asyncronous read." << std::endl;
        m_socket.get_io_service().stop();
    }
}
MikeAWood
  • 2,566
  • 1
  • 13
  • 13
MikeyB
  • 39,291
  • 10
  • 105
  • 189
  • Have you got any monitoring of the ethernet cards? Buffer size? Are they getting full up and panicking? – Tom O'Connor Apr 28 '12 at 14:21
  • I don't think the actual end user has any of that monitoring set up (wouldn't buffer size be too granular to monitor?) and I'm pretty sure that the buffer filling up wouldn't result in such a long (20 minutes!) performance hump. – MikeyB Apr 30 '12 at 21:38
  • Was the only thing I could think of x.x – Tom O'Connor Apr 30 '12 at 22:28
  • There is almost exactly one hour between the spikes. Is that consistent across your data? I'd probably turn OFF all the os and driver-level TCP accelerator stuff and see if it is a net-driver thing. Also, why is this tagged win2008? – Mark May 02 '12 at 21:22
  • It's a fairly consistent 90 minutes between the humps. It was tagged Windows 2008 as the behaviour still does appear but to a lesser extent. – MikeyB May 07 '12 at 15:53

3 Answers3

1

"It looks like there's some sort of deferred cleanup happening, but we have no idea what it could be."

This could be garbage collection, but I am not sure if garbage collection shows up as privileged time. If this is a .NET application, you can look at the .NET CLR Memory performance counters (Gen 2 in particular is expensive).

In this end guessing possible issues seems a bit backwards. Your best bet would be to profile your application and see what it is doing during this to see what the calls the application is making. You might be able to get away with just using Process Monitor to watch the syscalls.

Kyle Brandt
  • 83,619
  • 74
  • 305
  • 448
  • 1
    The code in question is c++, not `.NET`. I was theorizing some kind of OS-level garbage collection. – MikeyB Apr 30 '12 at 21:36
1

I assume that the system is receiving multicast packets. Can you try and prevent it from receiving the packets and see if you see the same problem?

What about joining the multicast group but then not listening for packets?

You say its happening on different systems, but what about the actual NIC hardware? It's possible that it's the same on those different systems.

Update: If all of the systems are using Broadcom NICs, it's possible that the problem is with the NIC. In particular, the Microsoft-supplied Broadcom drivers are lousy; the ones at Broadcom's web site are much better.

wfaulk
  • 6,878
  • 7
  • 46
  • 75
  • If no packets are received, everything stays flat. If we double the packet rate, the humps are doubled in amplitude. Only Broadcom hardware (different chipsets) has been tried. – MikeyB May 07 '12 at 15:54
  • 2
    @MikeyB: What drivers are you using? The Microsoft-supplied Broadcom drivers are awful. Try downloading the drivers from Broadcom's web site. – wfaulk May 07 '12 at 15:56
0

You could look at two things: your thread quantum and what's causing your DPC (delayed procedure calls).

Thread quantum is very easy to address (probably a red-herring, but may as well check it out);

  1. Right click on My Computer
  2. Select Properties
  3. Select the Advanced tab
  4. Select "Settings ..." under Performance
  5. Select the Advanced tab in the new windows (now we're DOUBLE advanced!)
  6. Under Processor Scheduling which is selected? "Programs" or "Background Services"?

Most likely Background Services is selected, try selecting Programs. This will decrease the amount of time between interrupts and allow more threads to be run in the same amount of time on the processor. You get more interrupts, but less processing time.

Delayed Procedure Calls are a little more difficult to diagnose;

As stated by @wfaulk this usually points to a driver issue. There's a handy tool called DPC Latency Checker which will help you diagnose these issues. Even though this is happening across multiple hardware platforms they all may still share a driver in common. Run DPC Checker and follow the instructions on their site.

Three follow up questions:

  1. Are you using teamed-NICs? They use the TCP/IP stack to communicate with each other and may cause serious DPC issues.

  2. Do your NICs support TCP Offload? Is it enabled?

  3. (A complete shot in the dark) Is your test server part of a domain? GPOs get refreshed every 90 minutes by default ...

Joseph Kern
  • 9,899
  • 4
  • 32
  • 56