3

Recently one of our servers has ran out of memory and crashed. After reviewing the munin graphs, it appears that the only metric (other than memory usage) that peaked just before the crash was the MySQL throughput. However we were expecting to see a corresponding increase in number of MySQL queries which didn't happen:

enter image description here

enter image description here

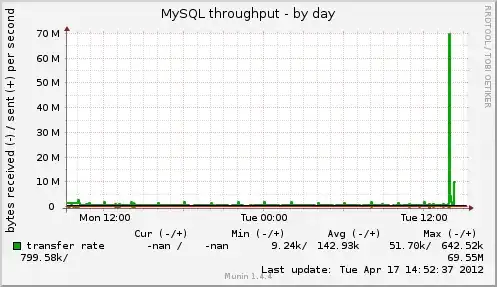
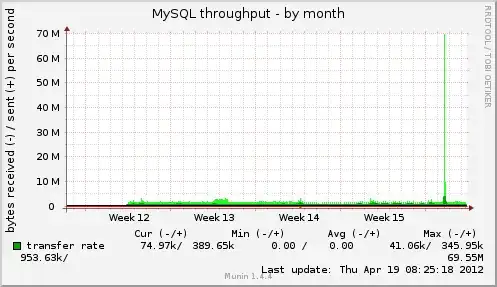
Also from below graph, you can see that the MySQL throughput has reached an abnormally high value, nowhere near any other value reached before:

enter image description here

We're completely in the dark as to how we should proceed, hence the below question:

How to perform a "postmortem" investigation of a MySQL throughput increase?

Max
  • 3,523
  • 16
  • 53
  • 71
  • You simply can't if you have no (other) data! – pfo Apr 19 '12 at 10:21
  • That we figured out :) We have the bin logs in `/var/log/mysql/`, the error logs in `/var/log/mysqld.log`, we just have know idea as to how going about them, except based on timestamps, hence the question before we go down that time-consuming process. – Max Apr 19 '12 at 10:27
  • Have you considered that his maybe a fragment of Munin's nummericals? – pfo Apr 19 '12 at 10:29
  • Sorry don't understand, please rephrase. – Max Apr 19 '12 at 10:37

1 Answers1

2

A query with a huge result set would cause a spike like that without seeing a corresponding increase in the amount of queries. Do you have any disk I/O monitoring? There should be a big spike in that as well, if this was caused by a query.

Unfortunately, a postmortem examination is difficult without general_log enabled. The error log won't show successfully executed queries.

Going forward, what I have done to try and catch these problems is keep a window of query logs. Enable general_log and setup logrotate to keep a brief history of queries. If that's too performance intensive, you could also try using a tool like mk-query-digest together with tcpdump to capture queries.

sreimer
  • 2,218
  • 15
  • 17