5

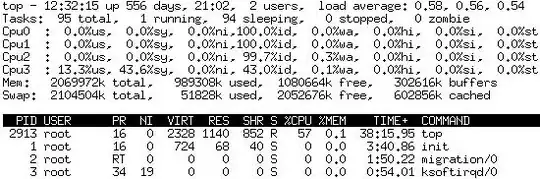
My system is SUSE 10 and I observe that top occupies 57% CPU usage when I use it.

top with 57% CPU

I don't have too many processes:

ps -eLf | wc -l
106

Here are top's stats:

cat /proc/2913/stat
2913 (top) R 2879 2913 2879 34819 2913 8396800 411 0 0 0 60648 199580 0 0 17 0 1 516504552 4811013274 2383872 285 4294967295 134512640 134596384 3215474448 3215470376 3085449998 0 0 0 138047495 0 0 0 17 3 0 0 0


cat /proc/2913/status 
Name:   top
State:  R (running)
SleepAVG:       79%
Tgid:   2913
Pid:    2913
PPid:   2879
TracerPid:      0
Uid:    0       0       0       0
Gid:    0       0       0       0
FDSize: 256
Groups: 0 
VmPeak:     2360 kB
VmSize:     2328 kB
VmLck:         0 kB
VmHWM:      1144 kB
VmRSS:      1140 kB
VmData:      260 kB
VmStk:        84 kB
VmExe:        84 kB
VmLib:      1788 kB
VmPTE:        16 kB
Threads:        1
SigQ:   2/16383
SigPnd: 0000000000000000
ShdPnd: 0000000000000000
SigBlk: 0000000000000000
SigIgn: 0000000000000000
SigCgt: 00000000083a7007
CapInh: 0000000000000000
CapPrm: 00000000fffffeff
CapEff: 00000000fffffeff
Cpus_allowed:   00000000,00000000,00000000,0000000f
Mems_allowed:   1

## cat /proc/2913/statm
582 285 213 21 0 86 0

What can I do next to find the reason why the top command is using so much CPU?

Wesley
  • 32,690
  • 9
  • 82
  • 117
DaVid
  • 91
  • 2
  • 3
  • I find the root cause。 – DaVid Mar 13 '12 at 02:40
  • top will read /var/run/utmp file to get active user number. But this file is so big with 178M. top spends about 8s to read it that maybe occupies 57% CPU usage. Change utmp size to 10 K, top command doesn't occupy more CPU usage. – DaVid Mar 13 '12 at 02:42
  • 1
    You should post this as an answer and accept it, otherwise the question will pop up again and again because it is not marked as "solved". – Gerald Schneider Sep 12 '18 at 10:09
  • 2
    On a side note, an uptime of 556 days also means that you aren't running the newest kernel, and most probably also not the current version of the services you are running on the machine. This is a security risk. – Gerald Schneider Sep 12 '18 at 10:10

2 Answers2

0

Your server is up 556 days. Though this shouldn't be a problem it is possible the long uptime is causing some funky behaviour like you're noticing. Without any identifiable cause. In my experience in such situations a fresh reboot clears up the problem right away. I understand it's a stupid solution, but why waste more time figuring it out?

If a reboot doesn't fix it then it's worth looking into it more deeply.

aseq
  • 4,610
  • 1
  • 24
  • 48
  • As you know, reboot is not a good way. Top command is a more popular tool to investigate other problem for Maintenance Engineer or Operation Engineer. – DaVid Mar 13 '12 at 02:47
  • Yes but it's his top command that is behaving strangely, i.e. it's using more CPU % than it should. Top normally only uses a couple of %. In this case using top to find out why top is behaving strangely is not the best thing to do. :-) – aseq Mar 13 '12 at 18:28
0

top is only using 1/8th of the CPU power of your ?netbook? you can see from this line:

PID  USER    PR  NI VIRT   RES  SHR S %CPU %MEM   TIME+   COMMAND 
2913 root    16  0  2328  1140  852 R   57  0.1  38:15.95 top

that it is only using what it says is 57%, while there are 94 tasks that are sleeping:

Tasks:  95 total,  1 running,  94 sleeping,  O stopped,  O zombie

you can then direct your attention to the middle section:

Cpu0 : 0.0%us, 0.0%sy, 0.0%ni,100.0%id, 0.0%wa, 0.0%hi, 0.0%si, 0.0%st
Cpul : 0.0%us, 0.0%sy, 0.0%ni,100.0%id, 0.0%wa, 0.0%hi, 0.0%si, 0.0%st
Cpu2 : 0.0%us, 0.0%sy, 0.0%ni, 99.7%id, 0.3%wa, 0.0%hi, 0.0%si, 0.0%st
Cpu3 :13.3%us,43.6%sy, 0.0%ni, 43.0%id, 0.1%wa, 0.0%hi, 0.0%si, 0.0%st

CPU0 is 100% in the idle state, as is CPU1 and CPU2, CPU3 is only occupying 43% of the time with system processes, and 13% of the time with user processes.

as the man 1 top page says:

       us, user    : time running un-niced user processes
       sy, system  : time running kernel processes
       ni, nice    : time running niced user processes
       id, idle    : time spent in the kernel idle handler
       wa, IO-wait : time waiting for I/O completion
       hi : time spent servicing hardware interrupts
       si : time spent servicing software interrupts
       st : time stolen from this vm by the hypervisor

top is only using

57/4% or 14%

of your processing power and only

.1%

of your memory.

Chris
  • 181
  • 2