9

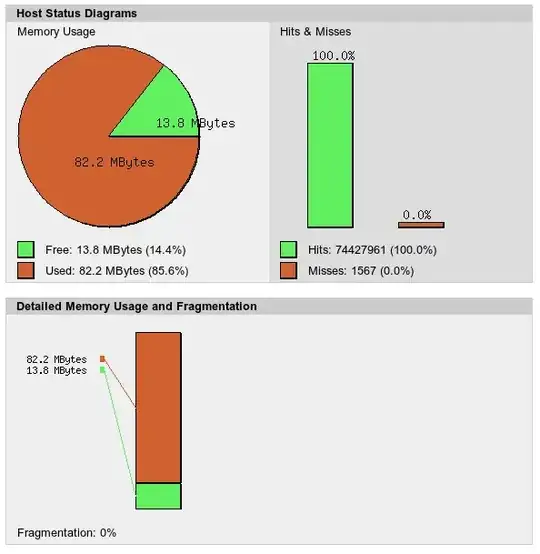
A few days ago I noticed a disk I/O wait and disk activity drop (which was great). Then I also notice that my cache was full(*) and fragmented. Then I flushed cache. After that, disk latency and disk activity jumped to the previous level (which was bad).

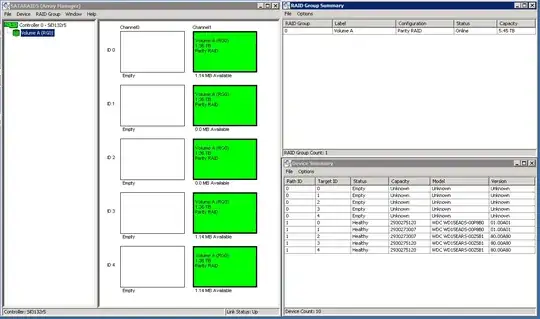
IOtop shows that [jbd2/sda2-8] and [flush-8:00] are always on top of disk usage. This is a Dell R210, hardware RAID 1 (H200) with a lot of free memory (16 GB in total, of which about 8 GB are buffer/cache).

(*) The cache is APC opcode cache for PHP, which reduces disk access for PHP script execution. Cache was full and fragmented because it included files from development instance. When I noticed that, I filtered them out.

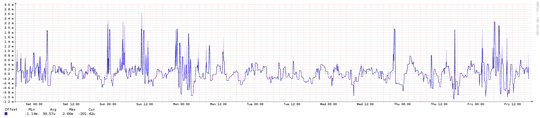
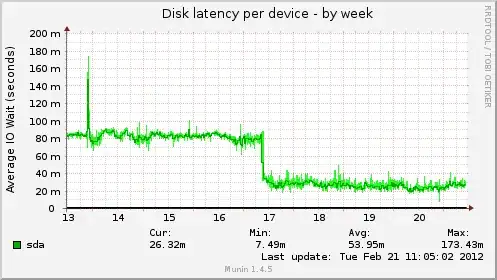
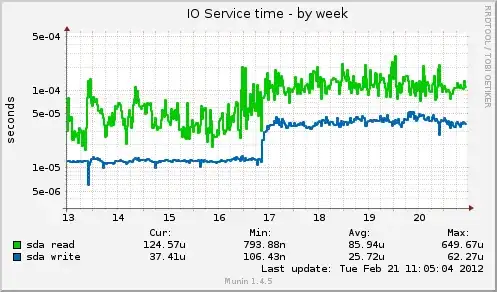
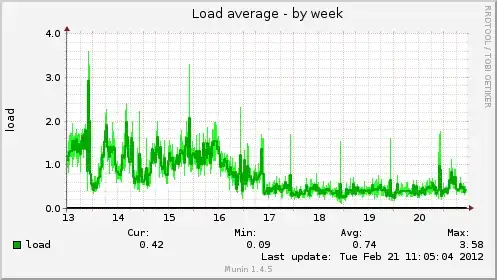
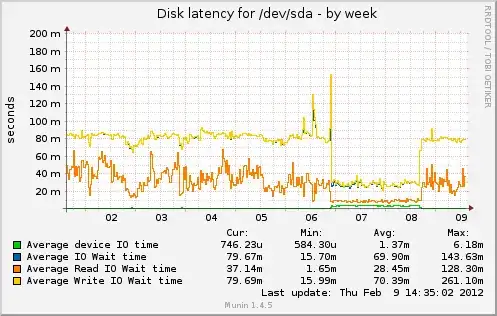
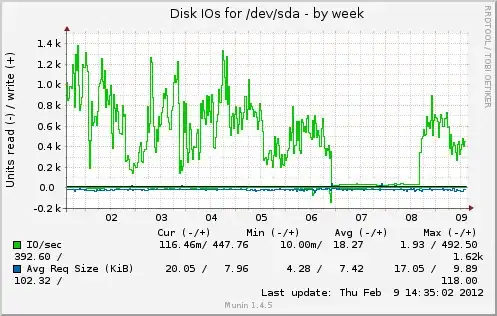
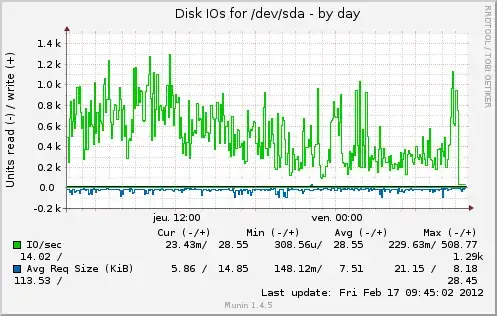
The question is: why disk I/O increases when theorically it should decrease? Below are some graphs from munin. Cache was full from Feb 6 to 8.

enter image description here enter image description here APC cache is currently ok.

Change after I commented out apc.mmap_file_mask as told by @cyberx86

enter image description here enter image description here

And after a few days https://serverfault.com/a/362152/88934

jcisio
  • 588
  • 1
  • 9
  • 22
  • 2
    That graph doesn't show an increase in IO. – psusi Feb 16 '12 at 23:38
  • 1
    If you use file-backed memory mapping (e.g. `apc.mmap_file_mask=/tmp/apc.XXXXXX`) you might see elevated I/O. Try setting `apc.mmap_file_mask` to use shared memory (e.g. `/apc.shm.XXXXXX`) or to `/dev/zero` (anonymous mmapped memory). – cyberx86 Feb 17 '12 at 01:04
  • 1
    @psusi from Feb 6th 12pm to Feb 8th 12pm it was low, then increased. – jcisio Feb 17 '12 at 06:57
  • @cyberx86 I've just changed it (commented out that line to use anonymous mmapped memory) and it looks like that help. I'll monitor a few minutes more to see. Thanks. – jcisio Feb 17 '12 at 08:23
  • It was zero during that time, then returned to about the same level it was at before. Presumably the site was down or something during that time. – psusi Feb 18 '12 at 02:27
  • @psusi I was nearly zero during two days, and I was on it, so I know that it was not down. The traffic was normal (a few dozens of thousand of visitors/day). The only difference in those two days is cache was full and heavily fragmented. – jcisio Feb 18 '12 at 08:19
  • so you are saying that the cache was working miraculously well during that time ( since there was no disk IO, it must have had a 100% hit rate ), and not at any other time? In other words, when you were worried about the cache being full it was working perfectly, and your fix put it back to working only normally? – psusi Feb 18 '12 at 15:57
  • 2
    @psusi There are/were multiple problems that I can only resume, not explain: 1/ APC cache miss (but OS cache hit for those PHP files, so very little disk I/O, less wait time but more avg I/O time, which mostly MySQL InnoDB transaction commit) 2/ APC cache hit but APC was using files (then OS cache miss, don't know why) 3/ brief, my question is "when cache worked badly, there is (almost) no disk I/O" - what you're saying is completely contrary to that. – jcisio Feb 18 '12 at 22:42

2 Answers2

10

If you use file-backed memory mapping (e.g. apc.mmap_file_mask=/tmp/apc.XXXXXX) you might see elevated I/O.

Try setting apc.mmap_file_mask to use shared memory (e.g. /apc.shm.XXXXXX) or to /dev/zero (anonymous mmapped memory). Keeping the setting undefined defaults it to using anonymous mmapped memory.

Usually, mmapped files is a great thing:

  • Compared to storing something fully in memory, mmapped files usually require less memory
  • Compared to saving something to a file, mmapped files require less disk I/O (since writes can be aggregated together).

However, compared to storing something purely in memory, they do incur added I/O - considerably so when the file is continuously changing. The downside of not using mmapped files is a lack of persistence - your cache will not survive a restart, since it is stored only in memory.

One may suggest therefore, that while the cache was filling up and stabilizing, it was undergoing the most change, which had to be constantly written to disk; once the cache was full, the ttl for each object slowed the rate that data in the cache was being turned over, decreasing the change and reducing disk writes.

cyberx86
  • 20,805
  • 1
  • 62
  • 81
4

After a few days, now I want to come back with some graphs. The change improves much that situation. It reduces everything, except the IO service time (I think it's because there is no longer trivial small PHP file read which is cheap).

enter image description here enter image description here enter image description here enter image description here

The server load (it was quite low already, so I had not discovered the change).

enter image description here

jcisio
  • 588
  • 1
  • 9
  • 22