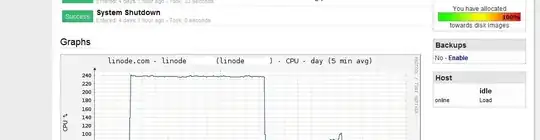
Linode offers system monitoring graphs as shown below.
Is it possible to add more graphs to the Linode dashboard by way of collectd? Say to view Memcache eviction rate.
Just to give you an idea this is the interface of RightScale, a deployment and management solution I use on Ec2.
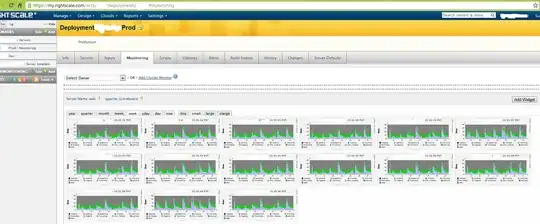 Whenever a RightScale template is booted it comes with a default set of collectd configuration. If I need more I just have to add the collect config or template for that.
Say I write a collectd plugin to monitor memcached evictions. Collectd is configured to send this to a RightScale monitoring server and it relays back to the interface.
Linode obviously is monitoring in some similar fashion since the basic system health is seen in the dashboard.