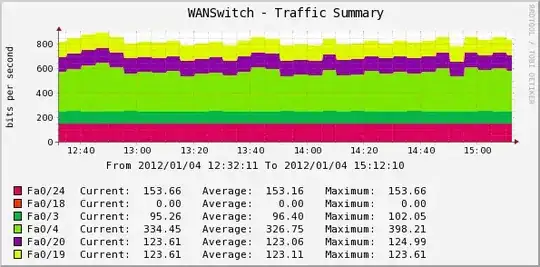
The final graph I want to plot is similar to below graph.
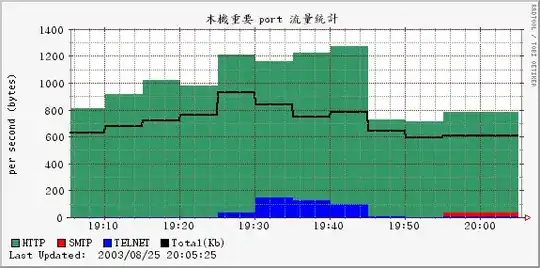
CDEF function to plot this graph manually (through command line) is like:
DEF:t1=$RRD_PATH:telnet:AVERAGE \
DEF:t2=$RRD_PATH:smtp:AVERAGE \
DEF:t3=$RRD_PATH:domain:AVERAGE \
DEF:t4=$RRD_PATH:http:AVERAGE \
DEF:t5=$RRD_PATH:total:AVERAGE \
CDEF:v1=t1,t2,t3,t4,+,+,+ \
CDEF:v2=t1,t2,t3,+,+ \
CDEF:v3=t1,t2,+ \
CDEF:v4=t1 \
CDEF:v5=t5,1024,/ \
AREA:v1#339966:"HTTP" \
AREA:v3#FF0000:"SMTP" \
AREA:v4#0000ff:"TELNET" \
LINE2:v5#000000:"Total(Kb)" \
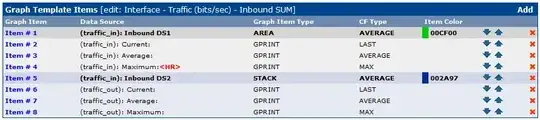
However, I want to define CDEF functions on Cacti Console/interface, to realize this "stacking effect". For example, inbound traffic of Fa0/1-24 is t1-t24, data presented on the graph should be: t1, t1+t2, t1+t2+t3, ... etc.
Any idea on this? Thanks.