0

I am a programmer for a popular website hosted by two web servers with apache. We're in the ~1000 alexa rank range to give you an idea. I'm not a server administrator.

Only one of them (always the same one) has been having a problem that started for the first time last week: every 2-3 days, it crawls to a complete halt timing out all HTTP connections and SSH connections as well. If you are already SSH'd in typing commands is either extremely slow (20-30 minutes before they appear) or doesn't work at all.

The only way to temporarily fix the problem that we found is rebooting the server.

I noticed this in our graphs:

enter image description here

enter image description here

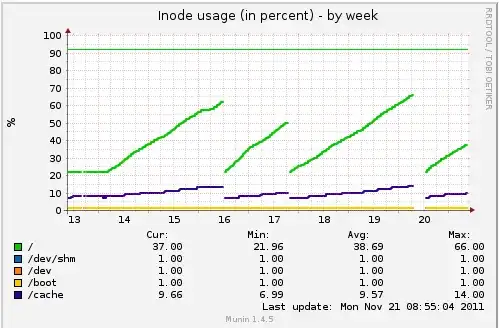
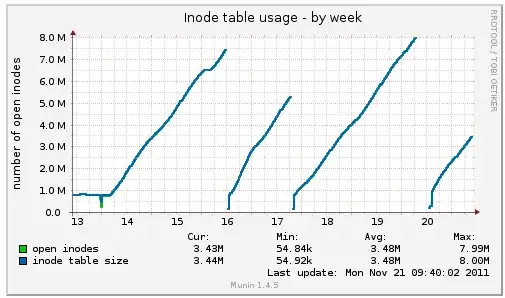
Every peak corresponds to the server halting, and every drop corresponds to the reboot we were forced to do.

How can I further debug this? Is there a way to see what process is using the most inodes? What would you do?

Andreas Bonini
  • 1,332
  • 1
  • 9
  • 16
  • 1
    Do any of the other monitors show anything peculiar? I don't find it likely that reaching 60% inode usage would bring your system to a screeching halt. Maybe the climb in inode usage is just a symptom of something else that might be going wrong. – Safado Nov 21 '11 at 15:41
  • @Ryan: I went over all our graphs, I found another "abnormal" one but it's inode related as well (I edited it in). – Andreas Bonini Nov 21 '11 at 15:47
  • possible duplicate of [Determine Location of Inode Usage](http://serverfault.com/questions/38907/determine-location-of-inode-usage) – quanta Nov 21 '11 at 15:48
  • @Ryan: something else I just found is that the memory allocated for "slab_cache" is considerably higher on www01 (the problematic server) than www02: 4 GB vs 1.5 GB. The servers and their software is pretty much identical. – Andreas Bonini Nov 21 '11 at 15:50
  • And if anyone else can answer this: Why would the inode usage drop after a reboot? Aren't inodes associated with persistent data that's written to disk? – Safado Nov 21 '11 at 15:50
  • Ryan, if it's dropping after a reboot, that may indicate some process releasing, say, open file handles upon termination. I would look at process tables, run "lsof" to see if there's any abnormal usage, etc. If this is one out of several identical boxes, I would be suspicious, as there might be an attacker. – cjc Nov 21 '11 at 16:11
  • Does your software perchance write a lot of data to `/tmp`? Is `/tmp` perchance not its own filesystem (taking up space on `/` until reboot, when all the data in `/tmp` should get dumped)? --- Also if you're not the server administrator perhaps you should have them come here and post more details. – voretaq7 Nov 21 '11 at 16:18

1 Answers1

1

The graphs you've embedded are showing the usage of in-memory inodes, not the one present on disk. The increase is very likely due to the fact that the number of open handles (files) on this system is increasing too. Maybe one of your processes is leaking handles, check the "lsof" output to verify that.

the-wabbit
  • 40,737
  • 13
  • 111
  • 174