10

We've been experiencing a lot of problems with our current office's internet connection lately: slowdowns, packet losses, huge ping times, etc.

(Un)fortunately, this is not happening all the day, just a few minutes here and there, several times a day, but that makes our working day a pain.

As Murphy's law dictates, when the IT guy pops up, the internet works just fine, ping is good, bandwidth is normal.

As they won't do anything more for us without further proof of failure, is there a good and simple tool (on whatever platform) that will monitor the connection for 24h (pinging Google every second, for example) and display the results as a graph of the ping time + packet losses at anytime of the day?

I gave a try PingPlotter, but that didn't work as intended for me.
BenMorel
  • 4,507
  • 10
  • 57
  • 85
  • 1
    What's wrong with PingPlotter? – joeqwerty Nov 18 '11 at 18:28
  • Most monitoring software will do this to at least some extent, but @Zoredache's suggestion of smokeping is probably the best-known standalone tool and is pretty much tailor-made for your issue. – voretaq7 Nov 18 '11 at 19:39

5 Answers5

12

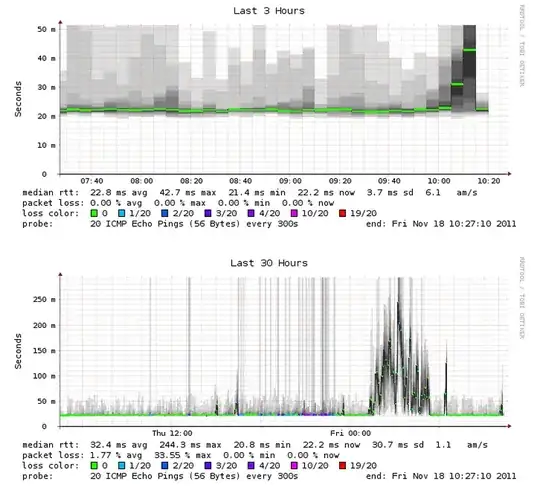
I would setup a copy of smokeping on some system on your network. It doesn't ping every second, and you probably don't need it do. Instead it will periodically send out a burst of ~20 pings at the same time, and then count how many respond, and how fast each returns. The results are graphed.

Here is results for my a system at home, over my Comcast connection, to something at work. The missed packets and latency is on the Comcast side.

enter image description here

Zoredache
  • 130,897
  • 41
  • 276
  • 420
6

If you have access to a linux machine then mtr may do what you want. mtr combines the functionality of the traceroute and ping programs in a single network diagnostic tool

This is the kind of output you get when run in report mode. You could just leave it running and gather statistics over any period of time.

mtr -r -c 10 google.com
HOST: host1.lan                   Loss%   Snt   Last   Avg  Best  Wrst StDev
  1. ns.lan                        0.0%    10    0.3   0.5   0.3   0.6   0.1
  2. 192.168.1.254                 0.0%    10   81.2  76.0  66.9  89.1   8.3
  3. 94-192-160-1.zone6.bethere.c 60.0%    10  2335. 1419. 1024. 2335. 620.4
  4. 10.1.3.245                   80.0%    10   17.3  17.6  17.3  17.9   0.4
  5. 10.1.2.169                   90.0%    10   28.1  28.1  28.1  28.1   0.0
  6. ???                          100.0    10    0.0   0.0   0.0   0.0   0.0
  7. 64.233.175.27                70.0%    10   23.5  23.6  23.4  23.8   0.2
  8. ???                          100.0    10    0.0   0.0   0.0   0.0   0.0
  9. ???                          100.0    10    0.0   0.0   0.0   0.0   0.0
 10. ???                          100.0    10    0.0   0.0   0.0   0.0   0.0
 11. ???                          100.0     8    0.0   0.0   0.0   0.0   0.0
 12. 173.194.67.147                0.0%     5   29.1  29.2  28.7  29.8   0.4
user9517
  • 115,471
  • 20
  • 215
  • 297
  • 2
    I have often run `mtr` as an hourly cron job in report mode to diagnose network problems. Running with intervals of 30 or 60 seconds is often adequate. This results in minimal impact on the network, but can give good results for periodic problems. – BillThor Nov 18 '11 at 23:11
  • Very good, `mtr` is definitely a good piece of software to find where the problem in the network lies! – BenMorel Nov 28 '11 at 18:32
3

You could just dump the output of ping to a file (ie ping google.com > pings.txt) and review the latency times. No graph, but works on basically every platform and should provide ample proof of any problems the network is experiencing.

Chris S
  • 77,945
  • 11
  • 124
  • 216
  • I'm aware of the `ping` option, but I'm actually looking for a way to display that on a timechart! – BenMorel Nov 18 '11 at 18:20
  • You really haven't given a good reason as to why. Your objective is to prove latency issues according to your Question, what do pretty graphs have to do with that? – Chris S Nov 18 '11 at 18:21
  • To check out at what time of the day this happens. They'll do the job of finding any time pattern in that! – BenMorel Nov 18 '11 at 18:31
  • Start the ping at midnight (00:00:00) and with the standard 1 second between pings, and you'll have one data point for every second in the day (86400 through 00:00:00 the next morning) - "They" can find the pattern in that too :-) – voretaq7 Nov 18 '11 at 19:42
  • I'm afraid that they won't even bother having a look at 86400 lines of text, even less trying to make a graph out of it :) – BenMorel Nov 21 '11 at 16:24
  • This is what I will do, in Python. I need to have an email alert to my phone whenever pings to my main router in-house gets too large. And I will write a log file with min/max over the day, plus any over-1000ms alerts. If I had it store all the output like you describe then I would use gnuplot to make visual output as a .PNG for daily summaries. But it is the occasional failing router that I am trying to catch. – SDsolar Mar 29 '18 at 04:32
2

Pingdom has a free service that may do what you need.

HostBits
  • 11,796
  • 1
  • 25
  • 39
  • Of course Pingdom can't tell you anything about your internal network.. Something that monitors from the inside out would probably be more appropriate to troubleshoot their issue – Safado Nov 18 '11 at 18:25
  • Well I guess that is one valid vantage point.. However the issue could certainly be an ISP issue, so external monitoring could help in that instance. – HostBits Nov 18 '11 at 18:28
  • Good point. Perhaps a ping monitor on their gateway router's public IP? If the issue is with the router itself or maybe a routing issue with the ISP that would work. – Safado Nov 18 '11 at 18:33
  • Good point indeed, that helped me figure out that the problem was not the actual internet connection of the building, but the poor Wi-Fi connection that they impose to connect our office network to the building router! – BenMorel Nov 28 '11 at 18:23
2

Nagios is an open source server monitoring tool that has the ability to monitor servers. I know that for SNMP monitors you have to configure things on the device being monitored but for simple ping monitors you shouldn't.

Here in our office we use WhatsUp Gold to monitor all our servers. It does have a ping monitor that does exactly what you're wanting. It's a pricey product ($2000+) which makes it a ridiculous solution to your problem, but they do have a free 30 day trial that you could install, gather data, and hopefully figure out your problem.

Safado
  • 4,786
  • 7
  • 37
  • 54