1

We've noticed that our Munin CPU graphs look a little odd on VMs that are quite busy.

VM is running Ubuntu 8.04, VMware tools up-to-date and running, host is VMware ESXi 4.1.0 build 348481.

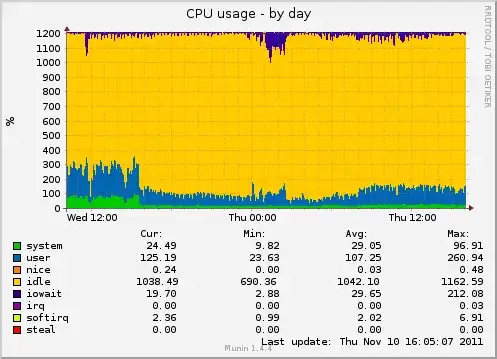
This is from a physical server:

Munin CPU graph on physical server

This is from a VM:

Munin CPU graph on virtual server

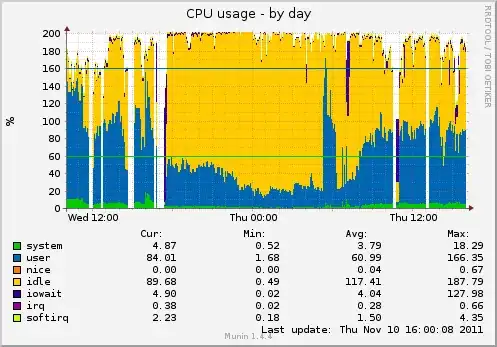
Notice that the VM has white areas at the top of the graph and the individual numbers don't add up to 200. This hasn't always been like this and I am struggling to think what could cause this.

Can anyone shed some light on this weirdness?

ThatGraemeGuy
  • 15,473
  • 12
  • 53
  • 79

1 Answers1

2

You need to be aware of what Munin actually monitors.

If Munin reads the CPU frequency, and takes the current usage as a percentage of that physical maximum, the readings will be off when the hypervisor did not assign the full CPU core to the guest.

That was just an example - the Munin documentation (and plugin source) will tell you exactly what is measured.

adaptr
  • 16,576
  • 23
  • 34