Pardon me but I'm still new to rrd graphing. I've come across lot of graphs where the MIN, MAX and AVG values are displayed alongside the legend labels. How do I create such graphs?
Asked
Active
Viewed 1.2k times
1 Answers
7
With the print / gprint options in your graph definition.
I think a good way to learn how this stuff is generated is to have a look at Cacti's graph templates where you can see how the graphs are combined from single elements.
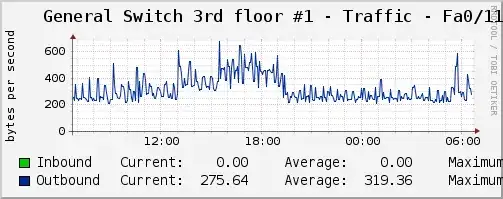
Edit: To illustrate that a bit better, just a random graph from a Cacti installation together with the command Cacti used to generate it. As you see, it will use the consolidation functions (AVERAGE, MAX, MIN) to calculate these values out of the measured data (a and b).
/usr/bin/rrdtool graph - \
--imgformat=PNG \
--start=-86400 \
--end=-300 \
--title='General Switch 3rd floor #1 - Traffic - Fa0/11' \
--rigid \
--base=1000 \
--height=90 \
--width=400 \
--alt-autoscale-max \
--lower-limit=0 \
--vertical-label='bytes per second' \
--slope-mode \
--font TITLE:12: \
--font AXIS:8: \
--font LEGEND:10: \
--font UNIT:8: \
DEF:a="/var/lib/cacti/rra/general_switch_3rd_floor_1_traffic_in_226.rrd":traffic_in:AVERAGE \
DEF:b="/var/lib/cacti/rra/general_switch_3rd_floor_1_traffic_in_226.rrd":traffic_out:AVERAGE \
AREA:a#00CF00FF:"Inbound"  \
GPRINT:a:LAST:" Current\:%8.2lf %s"  \
GPRINT:a:AVERAGE:"Average\:%8.2lf %s"  \
GPRINT:a:MAX:"Maximum\:%8.2lf %s\n"  \
LINE1:b#002A97FF:"Outbound"  \
GPRINT:b:LAST:"Current\:%8.2lf %s"  \
GPRINT:b:AVERAGE:"Average\:%8.2lf %s"  \
GPRINT:b:MAX:"Maximum\:%8.2lf %s\n"
Sven
- 98,649
- 14
- 180
- 226
-
Just that? Do I need to add separated RRA to keep those min/max/avg data during creating rrd? – Flint Sep 12 '11 at 04:33
-
@Flint: See my edit. – Sven Sep 12 '11 at 04:44
-
Ahh Ok I finally see how to create it. Many thanks for the example! – Flint Sep 12 '11 at 05:06