2

I recently came across a screenshot that looks to be using the "top" command, but it is showing a lot more in-depth info in terms of CPU usage:

enter image description here

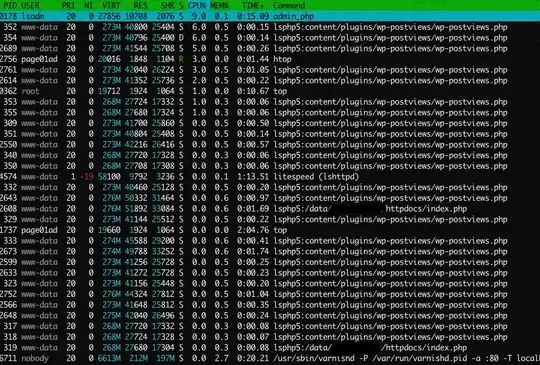
The program shows detail down to which plugin in Wordpress is taking up all the resources. How is this possible?

womble
  • 96,255
  • 29
  • 175
  • 230
brant
  • 169
  • 1
  • 7

2 Answers2

8

The tool used is htop. And advanced top.

In htop you could scroll, so it is possible to show the full process name, with php scripts, depending on your webserver

Thomas Berger
  • 1,700
  • 13
  • 22
  • Sorry guys, I've had to clear the comment list on this post. There were a *lot* of flags coming in over it (more than I ever would have imagined). Please re-create your comment thread with a bit less.. passion... if possible. – Mark Henderson Aug 22 '11 at 03:29
1

What's more in depth about that output than what is obtainable from regular top? Good programs will adapt their command line to provide more information about what they're doing (examples include resque and readproctitle), and top will pick that up and display it if you ask it to (the c command).

womble
  • 96,255
  • 29
  • 175
  • 230
  • The screenshot shows only a part of the `htop` output. If you want to know whats more advanced, use google – Thomas Berger Aug 21 '11 at 01:55
  • 1
    That's right; pressing "c" in usual Linux `top` is quite useful. ) – poige Aug 21 '11 at 07:09
  • The reason I made mention of this output is because it usually just shows that litespeed or PHP is causing CPU usage. However, this screenshot shows, not only the fact that its PHP, but its a particular plugin in Wordpress. – brant Aug 22 '11 at 21:32
  • It's actually just showing you the path to the PHP file that was requested, not anything special (it just happens that most of the PHP processes running at that moment were from a particular wordpress plugin). My answer explains how this is done. – womble Aug 22 '11 at 22:52