Below is a Munin Service Monitor screenshot for netstat by day which have a lot of failed connection. so I need to know is this a serious issue?
Below is a Munin Service Monitor screenshot for netstat by day which have a lot of failed connection. so I need to know is this a serious issue?
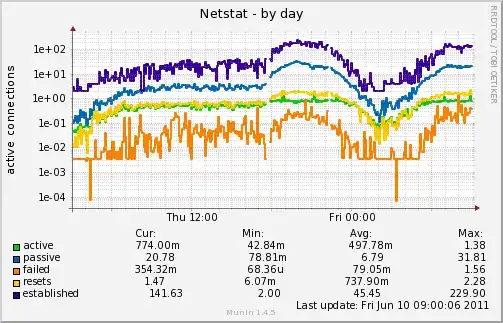
The number of "failed" connections in your graph is rather low. For some unfathomable reason, munin developers chose a logarithmic scale for graphing, but reading the y-axis you should see that the values for "failed" are somewhere between 1*10^(-2)/s and 1*10^(-1)/s, which expands to 3 - 30 failed connections within the 5 minute collection interval. Compared to the value of your successfully "established" connections which are graphed with a maximum of 230/s (or roughly 70,000 connections within the 5-min-interval) this is a rather low value.
So probably this is not a serious issue, unless of course you are investigating a particular problem and want to rule out failed connection setups as a possible cause.