I have an application deployed on WebLogic 10.3, which exhibits a strange behavior.
- I am running a constant (not too high) load on my application (20 concurrent users, running a light activity).
- The response time is reasonable (well below 100ms after the application stabilizes)
- Memory consumption seems fine (My application creates a lot of short-living objects, but they are garbaged collected so the overall memory consumption stays under 500 mb).
- Threads stats seem healthy as well:
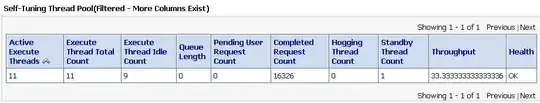
And yet, after I leave my test running for a while, more and more execute threads ("[ACTIVE] ExecuteThread: '3' for queue: 'weblogic.kernel.Default (self-tuning)'") are created, until eventually the application crashes:
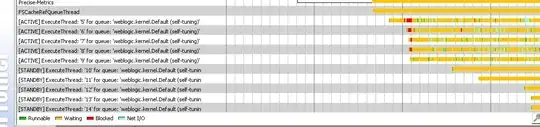
This test hasn't been running for a long time (All the new threads that you don't see in the first screenshot were created while I was writing this question), and I've seen much more threads being created.
Any idea why these threads are being created?