5

Where I work at, we have a bunch of Cisco Catalyst 3560 switches (plus two routers), which no one knows how to administer (the guys who installed them, it turns out, don't like doing tech support for free), so I'm stuck trying to figure out how to do even the simplest of tasks.

Currently, I'm trying to find out which workstations are sucking our bandwidth, and the Port Statistics interface seems like a good start (too many packets =~ lot of traffic). However, while I can see the statistics in the Device Manager (the web interface), I can't find the command-line version of said statistics, which I need if I want to write a script. I have the root password for the switches, so I can ssh into the devices, but I can't find which commands are the ones I need.

So far, I've tried:

  • show interfaces counters: I realy hoped this one would work, but it seems those are statistics of dropped packets, not regular traffic, so it doesn't work
  • show interfaces: This one actually shows a "5 minute input/output rate" field, but 5 minutes is too short - after 5 minutes of downloading, the offenders would be free to go again
  • Copy and paste the information from the web interface, one switch at the time, pasting them in an Excel spreadsheet and working from there. That works, but every time I do that by hand I die a little inside

Any ideas? In case you ask: yes, it would be smarter to check this in the router instead of the switches, but I know nothing about Cisco, so toying around with the router scares me like a little girl (I do know about regular networking, though), and yes, there is a proxy on the way, but those things take time (check the "How do I plug a proxy into a Cisco router?" question next month).
Martin
  • 143
  • 1
  • 2
  • 11

3 Answers3

5

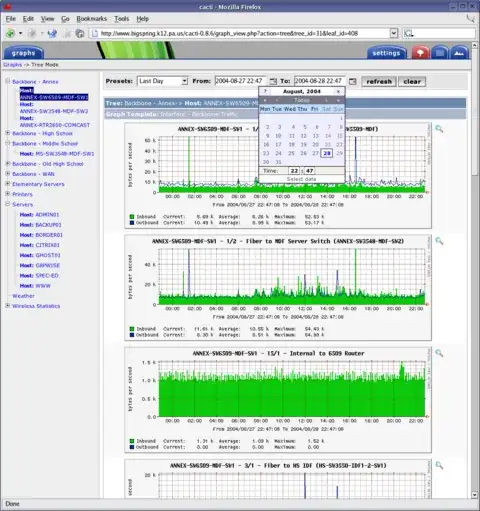
To make this easy for yourself (and show off some pretty graphs), I'd just install Cacti and use SNMP to monitor the switch ports.

alt text

ben lemasurier
  • 768
  • 6
  • 21
  • How about MRTG? Cacti doesn't work with PostgreSQL (our official database), just MySQL, and for what I read hacking Cacti would take even more time that my first idea... – Martin Nov 15 '10 at 17:38
  • MRTG works great and is a proven classic. It's a little clunky to initially setup, but it's lightweight once running and universally accepted. – PMGoldstein Nov 15 '10 at 17:41
  • Yep, MRTG is essentially what Cacti is using (its just all packaged up and easy to configure). Personally, I use a combination of Munin, ntop, flow-tools and flow-capture. – ben lemasurier Nov 15 '10 at 17:55
  • Cacti only uses MySQL for its configuration data. The data it polls from your switches and other devices is stored in round-robin database files using RRDtool (http://www.mrtg.org/rrdtool/). – James Sneeringer Nov 15 '10 at 19:07
  • Whats the command for enabling snmp traps for monitoring traffic on each interface – alsadk May 30 '18 at 15:59
2

In the "show interface" output, you'll see cumulative counters since the last counter reset ("clear counters []", no specified interface clears counters for all interfaces). This allows you to take snapshots at whatever interval you want. It's the same counters as used by the SNMP management interface (Cacti, MRTG and other monitoring software) and should be relatively easy to parse.

If you're happy scraping the CLI output and do it yourself, that MAY be a quicker way to get up and running with this specific task. I do suspect that some training material and time to install MRTG or Cacti will be worth your time investment, though.

Vatine
  • 5,440
  • 25
  • 24
-1

I followed a howto similar to this one:

http://linuxbasement.com/content/mrtg-ubuntu-server

It's been running quietly ever since, generating rrd graphs similar to the one pictured in Cacti up above.

It's not the prettiest, or most effective, but it's a point in the right direction and should give you an estimate of what you're looking for.

erimar77
  • 488
  • 2
  • 8