0

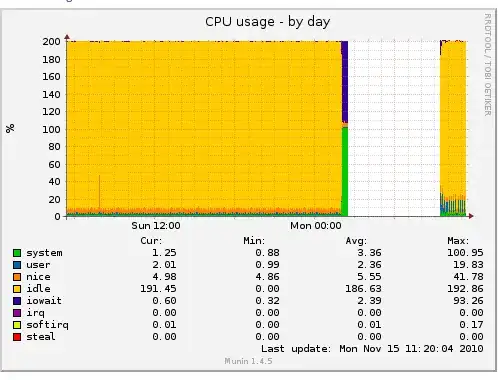
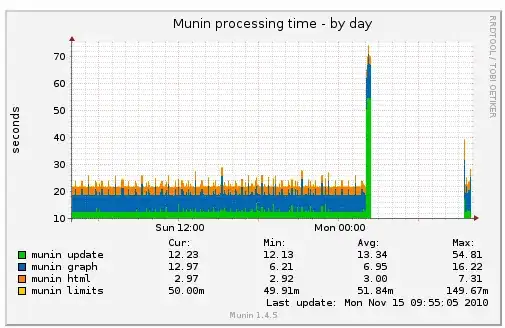
I have been unable to work out what is happening here. I have attached the graphs below. and as you can see the processes just seem to climb inline with the Munin processing times leaping up. The server then locks out and the graph goes dead. I have asked in the Munin IRC channel but I have found no answers there.

This install of Munin was completed using the standard Ubuntu packages and it monitors two servers as well as itself so nothing too dramatic.

Any ideas of what might be causing this and ideally how to fix it?

Munin processing time graph screenshot Munin CPU processes graph screenshot Munin CPU graph IO stats

Treffynnon
  • 249
  • 4
  • 12

1 Answers1

3

Are you sure Munin is causing this and not simply reporting the problem that something else is causing? I say this because munin seems to be working fine, reporting the usage as 130 sleeping processes for most of a day. Then over around half an hour at 2am processes start building up that are in uninterruptible sleep.

You need to find out what is going on on the system during this time. If this happens regularly, try starting up a screen and then doing an "ssh" to the system. Then run "while true; do ps awwlx; sleep 60 done". This will cause a list of the processes running to be sent every minute. Then once it locks up again you can connect back up to the screen and see what processes were there, ideally which ones were in "D" status (uninterruptible sleep).

Also look at other graphs, like memory usage and disc I/O. Does the disc I/O go through the roof? It probably does. Does memory use go up? Could the system be swapping and thrashing itself to death? My guess would be that you have some process or processes that start using up a lot of memory, causing the system to swap itself to death. The "ps awwlx" should show this, as memory usage is written out as well.

Another thing you may want to run in a screen is "vmstat 1", which displays a line about the system usage every second. Of particular use are the "swap" and "CPU wa" numbers.
Sean Reifschneider
  • 10,720
  • 3
  • 25
  • 28
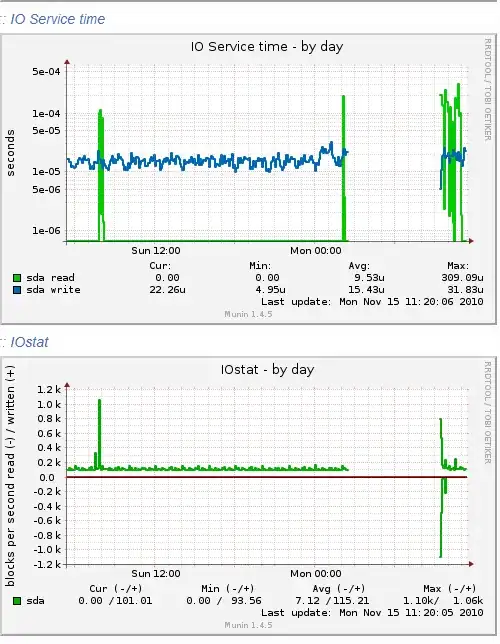
  • Memory usage does go up but not by much and swap is never hit according to the graphs from Munin. The disk does not appear to be under too much load either as the latency actually goes down. – Treffynnon Nov 15 '10 at 11:29
  • I have added IO stats and the CPU graph to the original question. – Treffynnon Nov 15 '10 at 11:31
  • Note how the CPU usage is all system and I/O wait. System CPU time is time spent in the kernel. One common cause of that is directories with huge numbers of files in them, on the order of a million or more. Say, someone's spam box that never gets cleaned out. The best way to tell is to run the "ps" as I mentioned and see what processes are in "D" state. Maybe even log processes in D state so you can see what first starts getting in D state, because by the time the system hangs, MANY things may be in D that are unrelated. – Sean Reifschneider Nov 15 '10 at 13:29
  • Looks like I am not going to get an opportunity to test it out any time soon. Too busy with client project apparently so will just reboot it at the beginning of everyday for the time being. Thank you for the tips on tracking the problem down though. – Treffynnon Nov 15 '10 at 22:32