5

I currently use Amazon S3 for much of my static file serving needs but my monthly bill is getting very expensive. I did some rough calculations using the logs and at peak times, my most expensive Amazon bucket is handling about 100 180 Mbps of traffic. Mostly images under 50K.

S3 is hugely helpful when it comes to storage and redundancy but I don't really need to be paying for bandwidth and GET requests if I can help it. I have plenty of inexpensive bandwidth at my own datacenter, so I configured an nginx server as a caching proxy and then primed the cache with the bulk of my files (about 240 GB) so that my disk wouldn't be writing like crazy on an empty cache.

I tried cutting over and my my server choked.

It looks like my disks were the problem - this machine has 4 x 1 TB SATA disks (Barracuda XT) set up in RAID 10. It's the only thing that I had on hand with enough storage space to be used for this. I'm pretty sure nginx was set up properly as I had already been using it as a caching proxy for another, smaller Amazon bucket. Assuming that this is a reasonable amount of traffic for a single machine, maybe an SSD would be worth a try.

If you handle large amounts of static file serving, what hardware do you use?

additional information

Filesystem: ext4, mounted noatime,barrier=0,data=writeback,nobh (I have battery backup on the controller) Nginx: worker_connections = 4096, worker_rlimit_nofile 16384, worker_processes 8, open_file_cache max=100000 inactive=60m

outcassed
  • 1,290
  • 1
  • 9
  • 11
  • Are you sure the bottleneck is your disk setup or are you running into paging issues from overflowing system memory? – Cypher Oct 03 '10 at 21:49
  • Nope - no swapping.. and about 40 GB of free memory. – outcassed Oct 03 '10 at 22:20
  • So... my question wasn't "are my disks the problem"? They are the problem (or... they are so much of a problem that they obscure any other problems). I was just wondering what other people are using to handle this sort of traffic. – outcassed Oct 04 '10 at 14:15
  • Have you determined how large a portion of your files are actively used? Is it the same 5% of files being server 95% of the time or is the distribution more even? Warming your block cache could make a big difference assuming the bulk of your requests is over a set of files that is a good bit smaller than the amount of RAM you have. – Ryan Bair Oct 04 '10 at 15:56
  • One quick thought: did you set noatime? – BMDan Oct 04 '10 at 17:44
  • @BMDan Yup. ext4 with noatime. – outcassed Oct 04 '10 at 17:55

5 Answers5

2

Your. Discs. Suck. Point.

  • Try getting a lot more and a lot faster discs. SAS comes nicely here, as doe Velociraptors.

  • That said, the best would be getting... a SSD.

Your discs probably do around 200 IOPS each. With SAS you can get that up to around 450, with Velocidaptors to about 300. A high end SSD can get you... 50.000 (no joke - I really mean 5 0 0 0 0 0 0) IOPS.

Make the math ;) A single SSD, no RAID, would be about 62 times as fast as your Raid 10 ;)

TomTom
  • 51,649
  • 7
  • 54
  • 136
2

I don't think your disk is the issue. First nginx's ncache uses a disk store for cache. So, disk speed is going to be one potential cause of issues depending on how hot/cold your dataset is, however, I see no reason that you couldn't serve 100mb/sec with the hardware you've mentioned - especially if you're using nginx.

First thing I would guess is your # of worker processes was low, your worker_connections were probably way too low, and you probably didn't have your open_file_cache set high enough. However, none of those settings would cause a high IO Wait nor a spike like that. You say that you are serving <50k images and it looks like 1/4 of your set could easily be buffered by the OS. Nginx is surely not configured optimally.

Varnish handles the problem in a slightly different way using RAM rather than disk for its cache.

Much depends on your dataset, but, based on the data you've given, I don't see any reason for disk IO to have spiked like that. Did you check dmesg and the logs to see if one of your drives encountered some IO errors at the time? The only other thing I can think that might have caused that spike was exceeding nginx's filecache which would have caused it to have to go into a FIFO mode opening new files.

Make sure your filesystem is mounted with noatime which should cut a considerable amount of writeops off your workload.

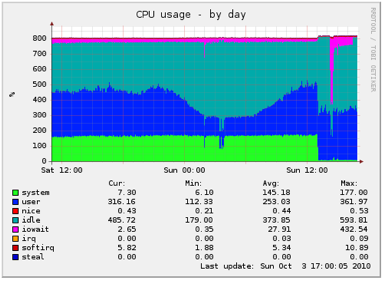
As an example of a machine that regularly handles 800mb/sec:

# uptime
 11:32:27 up 11 days, 16:31,  1 user,  load average: 0.43, 0.85, 0.82

# free
             total       used       free     shared    buffers     cached
Mem:       8180796    7127000    1053796          0       1152    2397336
-/+ buffers/cache:    4728512    3452284
Swap:      8297568     237940    8059628

Quadcore Xeon:
    Intel(R) Xeon(R) CPU           X3430  @ 2.40GHz

$ ./bw.pl xxx.xxx 2010-09-01 2010-09-30
bw: 174042.60gb

average 543mb/sec, peaks at 810mb/sec

=== START OF INFORMATION SECTION === Model Family:     Seagate Barracuda
7200.12 family Device Model:     ST3500418AS Serial Number:    6VM89L1N
Firmware Version: CC38 User Capacity: 
500,107,862,016 bytes

Linux 2.6.36-rc5 (xxxxxx)   10/04/2010  _x86_64_    (4 CPU)

avg-cpu:  %user   %nice %system %iowait  %steal   %idle
           4.33    0.00    2.40    5.94    0.00   87.33

Device:            tps   Blk_read/s   Blk_wrtn/s   Blk_read   Blk_wrtn
sda             109.61     19020.67       337.28 19047438731  337754190

avg-cpu:  %user   %nice %system %iowait  %steal   %idle
           8.09    0.00    3.40   10.26    0.00   78.25

Device:            tps   Blk_read/s   Blk_wrtn/s   Blk_read   Blk_wrtn
sda             138.52     21199.60       490.02     106210       2455

avg-cpu:  %user   %nice %system %iowait  %steal   %idle
           3.74    0.00    3.25    9.01    0.00   84.00

Device:            tps   Blk_read/s   Blk_wrtn/s   Blk_read   Blk_wrtn
sda             125.00     21691.20       139.20     108456        696

avg-cpu:  %user   %nice %system %iowait  %steal   %idle
           4.75    0.00    3.12   14.02    0.00   78.11

Device:            tps   Blk_read/s   Blk_wrtn/s   Blk_read   Blk_wrtn
sda             154.69     19532.14       261.28      97856       1309

avg-cpu:  %user   %nice %system %iowait  %steal   %idle
           6.81    0.00    3.36    9.48    0.00   80.36

Device:            tps   Blk_read/s   Blk_wrtn/s   Blk_read   Blk_wrtn
sda             112.80     17635.20       309.00      88176       1545

MRTG:

https://i.stack.imgur.com/CRqPi.png

Dataset:

# du -sh ads
211.0G  ads

# ls|wc -l
679075
karmawhore
  • 3,865
  • 18
  • 9
  • Why would you want ncache to cache static files on disc that are already located on disk? The kernel should do a fine job caching on its own. – Ryan Bair Oct 04 '10 at 15:50
  • His question stated he had Nginx at his data center caching an S3 bucket. My data merely shows that Nginx running on decent hardware is able to handle 8x what his requirements are which was the second part of his question. Which part did you find confusing so I can edit my answer? – karmawhore Oct 04 '10 at 16:24
  • Awesome - thanks for the real world info. I added some additional info about nginx and filesystem configuration to my question. – outcassed Oct 04 '10 at 16:50
  • Handling about 1/3rd of requests now as an experiment, no problems. My read IOPS are at 120-140. – outcassed Oct 04 '10 at 17:58
  • run iostat -x 5 5 are you hitting 100% (or close to it) on any of the disks? worker_rlimit_nofile/worker_connections seem low for the amount of traffic you're pushing, but, I don't see anything that would cause the issue you had. I don't recall how nginx handles LRU cleanup - is it possible all of your content expired at the time your IO skyrocketed? what was your lifetime set to? – karmawhore Oct 04 '10 at 20:23
  • On your graph, 1pm, serious drop in user% and system%. Was this when you turned on nginx caching? Disk IO spiked almost exactly an hour later then was heavy for another 2.5 hours. I'm assuming 4:30pm on the graph is where you put things back. What were your proxy_cache settings? Another possibility is that you overran your keyzone and had more hot data than your keyzone could handle. – karmawhore Oct 04 '10 at 20:52
  • The user% was my cache priming job (GNU parallel and wget). Once it stopped, it was ready to serve. I put things back right after the spike. um. 4:30 might have been disabling another smaller cache as well. Here is a new iowait graph that includes today: http://skitch.ravelry.com/iowait-20101004-170656.png proxy_cache settings: levels=1:1:2 keys_zone=images-cache:1024m max_size=1500000m inactive=86400m – outcassed Oct 04 '10 at 21:08
  • iostat is high. Around 90%. Chart 1: http://skitch.ravelry.com/diskio-20101004-171433.png / Chart 2: http://skitch.ravelry.com/iostat-20101004-171512.png These disks are 2 TB Barracuda XTs in RAID 10 set. Not awesome, but I expected more from them. – outcassed Oct 04 '10 at 21:13
  • proxy_buffers/proxy_buffer_size disk logging off? you sure you're caching and not hitting S3 for 90% of your requests? is your proxy_cache_path actually filling up with cache data? Do you see any in there that is 'old' or is it possible something is expiring data too soon? expire times, no-cache headers being sent from client or S3 that might be invalidating your cache? – karmawhore Oct 04 '10 at 21:35
  • Ext4 journaling is off. Yep. I'm sure I'm caching - I can tell by the outgoing traffic http://skitch.ravelry.com/mrtg-20101004-174940.png and by the growing cache dir (well, not so much now since I primed the cache) Expiry is 10 years out, cache-control is public, redbot.org is happy with the headers. (PS - Thanks for troubleshooting this with me) – outcassed Oct 04 '10 at 21:45
  • well, disk io at 90% is pushing the edge, but, with the amount of ram you have, I'm not sure why nginx is doing so much read/write unless your dataset is mostly cold. Even though nginx does store the cache on disk, the OS should be buffering a large portion of it. – karmawhore Oct 05 '10 at 00:42
  • I don't have that much really hot frequently accessed data so that makes sense. I've got another machine with a 2 Ghz quad core and 8 GB of RAM. Looking at your data, it sounds like machine should have no problem with this load as long as the disks are fast enough. Thanks! – outcassed Oct 05 '10 at 00:52
1

We're serving about 600 Mbps off of a server with SSDs on the backend, and nginx+varnish on the front. The actual processor is a little Intel Atom; we've got four of them behind a LB doing 600 Mbits/sec each (using DSR). Perhaps not appropriate for every situation, but it's been perfect for our use case.

BMDan
  • 7,249
  • 2
  • 23
  • 34
0

Does the machine you are using have enough ram to have the working set of files cached in RAM?

Also - have you looked at something like Varnish? Nginx is great for handling tons of connections - but it's not the ultimate in terms of caching and systems performance.

gabbelduck
  • 329
  • 1
  • 3
0

Add much more disks. You can trade single disk speed with number of disks (up to a certain point): maybe you can get the same performance with X expensive SAS 15kRPM disks or with (guessing, not meaningful values) X*2 cheap SATA 7k2RPM disks. You have to do your math and see what's better for you - and that also depends on how much you pay rack space and power at your datacenter.

SSD will give you all the IOPS you'll need but they're not cheap for bulk storage (that's why their primary use case is database like workloads).

Luke404
  • 5,826
  • 4
  • 47
  • 58