1

http://farm4.static.flickr.com/3305/4588110530_a60c934289_o.png

This graph is munin collecting netstat -s output.

I want to determine where the connections are coming from. There is nothing obvious in wireshark dumps.

It's been a while since I've done anything fancy with iptables. How can I go about logging these?

Thanks

-s

someara
  • 21
  • 1
  • 3

3 Answers3

1

To determine where the connections are coming from.... Here is an example to log SSH traffic. The format will look like this in your kernels log

MONTH DAY TIME SERVERNAME kernel: [IPTABLES] : IN=eth0 OUT= MAC=00:00:00:00:00:00:00:00:00:00:00:00:00:00 SRC=REMOTEIP DST=SERVERIP LEN=00 TOS=0x00 PREC=0x00 TTL=# ID=# DF PROTO=TCP SPT=# DPT=22 WINDOW=# RES=0x00 SYN URGP=0 OPT (#)

Here we create a new chain called MyLOG

# iptables -N MyLOG

Flush the new chain just in case

# iptables -F MyLOG

create the logging feature on tcp port 22 set the logs to alert and an easy to see "[IPTABLES]" string to the beginning of the log line.

# iptables -A MyLOG -i eth0 -p tcp --dport 22 -j LOG --log-level alert --log-tcp-options --log-ip-options --log-prefix '[IPTABLES] : '

attach MyLOG chain to input chain

# iptables -A INPUT -i eth0 -j MyLOG

This should send the logs to your kernel log (though some flavors of linux may vary the results). You can test the logging by tailing your kernel log.

# tail -f /var/log/kern.log

If you are at the console and notice the tons of data splattering across your screen you can try setting the console log output with

dmesg -n 1

If you want to get "statistics" you can run

# iptables -nvxL

the output will show the amount of packets and bytes sent from the time the chain was created.

Chain MyLOG (1 references)
    pkts      bytes target     prot opt in     out     source               destination
      61     4416 LOG        tcp  --  eth0   *       0.0.0.0/0            0.0.0.0/0

I have a script here http://www.hilands.com/code-shell-fw.html which I used to log certain port activity, and collected data for serverstats serverstats (downloadable from berlios), setup NAT'ing, port-forwarding, attempts to break port scans, and uses tcp-rejects instead of drops.

Serverstats can be difficult to figure out. Its a set of PHP scripts that uses RRDTool. It uses a shell script to trigger the iptables output. My garbled notes tell me you need to modify the configuration array with something like this to get it to run

'ssh-traffic' => array(
        'used' => true,
        'chains' => array('MyLOG'),
        'graphs' => array(
            'combined_bps' => array('used' => true, 'title' => 'Combined (bps)'),
            'single_bps' => array('used' => true, 'title' => '%s (bps)'),
            'combined_count' => array('used' => true, 'title' => 'Combined (count)'),
            'single_count' => array('used' => true, 'title' => '%s (count)')
        )
    ),
The-Phil
  • 41
  • 2
1

Thanks for the replies guys.

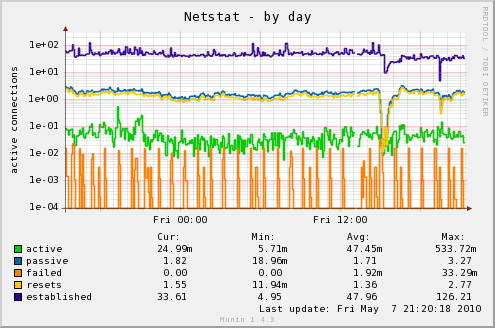
My goal here is to understand why the spikes in the graph are regular and cyclical, and then make them stop. These are coming in at a slow trickle (5 or so at a time). I understand that tcp connections fail for one reason or another, but there is obviously something afoot because of their regularity. I suspect a cron job somewhere, a load balancer misconfiguration, or a monitoring device as the culprit.

I've decided to take the UTSL approach, and here's where I'm at so far:

netstat -s gets it's statistics from /proc/net/snmp.

Great. So the kernel updates an SNMP counter every time there is a failed connection attempt.

What id like to accomplish, is every time there is a failed connection, to not only updates this counter, but to also log "failed connection attempt from IP $foo at $timestamp"

So... what qualifies as a failed connection attempt?

downloads kernel source greps around concludes that the counter I'm looking for is TCP_MIB_ATTEMPTFAILS

grepping through the 2.6.18 source tree, I've found two places where this is referenced:

./net/ipv4/tcp_minisocks.c:

453 struct sock *tcp_check_req(struct sock *sk,struct sk_buff *skb,
454                            struct request_sock *req,
455                            struct request_sock **prev)
456 {

592                 if (flg & (TCP_FLAG_RST|TCP_FLAG_SYN)) {
593                         TCP_INC_STATS_BH(TCP_MIB_ATTEMPTFAILS);
594                         goto embryonic_reset;
595                 }

640 }

... and, include/net/tcp.h

915 static inline void tcp_done(struct sock *sk)
916 {
917         if(sk->sk_state == TCP_SYN_SENT || sk->sk_state == TCP_SYN_RECV)
918                 TCP_INC_STATS_BH(TCP_MIB_ATTEMPTFAILS);
919 
920         tcp_set_state(sk, TCP_CLOSE);
921         tcp_clear_xmit_timers(sk);
922 
923         sk->sk_shutdown = SHUTDOWN_MASK;
924 
925         if (!sock_flag(sk, SOCK_DEAD))
926                 sk->sk_state_change(sk);
927         else
928                 inet_csk_destroy_sock(sk);
929 } 

I'm a bit surprised that these are the only two conditions that generate a counter update, but whatever.

The first block seems pretty obvious. "If you see a TCP packet with both the RST and SYN flags set, update the TCP_MIB_ATTEMPTFAILS counter and reset the connection".

In an attempt to catch these, I put in the following iptables rules

iptables -A INPUT -p tcp -m tcp --tcp-flags SYN,RST SYN,RST -j LOG
iptables -A OUTPUT -p tcp -m tcp --tcp-flags SYN,RST SYN,RST -j LOG

waits ….. nothing. =(

The second block is a little more mysterious, but I'm going to guess and assume that this means "update the TCP_MIB_ATTEMPTFAILS counter if the socket is in a certain state when tearing it down"

This, I have no idea how to test for this.

My questions are now: 1) Am I misinterpreting this graph somehow? 2) Am I on the right track? 3) Short of writing a kernel module (which I'm no where near skilled enough to do), how can I accomplish my logging goal?

Thanks

-s

someara
  • 21
  • 1
  • 3
0

I'm not sure iptables is what you want, there may be a tool which stays active and polls the same syscalls netstat uses, or you could write one.

iptables reacts to packets, to process them. what you're looking at is basically an allocation table for all active sockets.

Now, depending on what these actually are, you MIGHT be able to catch packets on these connections.

If you have a lot of sockets in a state that isn't very impressive, for a long time, continually growing to higher and higher numbers, i'd be more concerned with the output of netstat -anp, iirc, which tells you the program. Maybe someone is leaking sockets.

That's highly presumptive of me. Howabout elaborating as to what you want to see change in that graph.

I commented on myself but it didn't show up, so I'll just edit - the other post is absolutely a clear instruction of how to log, with iptables, traffic that you should be able to see with wireshark. It just sounds to me like you're asking about sockets, not packets. The sockets that are tough to track down are not getting / sending packets, typically, and sometimes that indicates resource waste.