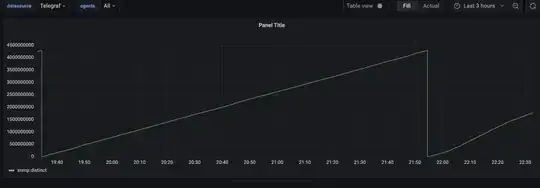
I am getting a sawtooth style of graph on Grafana when I am tying to monitor the ISP WAN interface of my Fortinet firewall. Can someone please guide me on getting the right graph for the WAN interface bandwidth? The fortinet shows a much smoother and flatter curve but my graph is a sawtooth, here is my OID, oid = "1.3.6.1.2.1.2.2.1.16.187" where 187 is the interface snmp index. Please guide me on this.
Asked
Active
Viewed 51 times
1
-
1.3.6.1.2.1.2.2.1.16.x counts octets, not bandwidth. Just use the difference to the previous value. – Zac67 Jul 30 '23 at 09:29
-
@Zac67 can you explain a bit more without cliffhanging us? ;) – djdomi Jul 30 '23 at 13:59
-
@djdomi mean bandwidth in bytes = (ifoctets@t1 - ifoctets@t0) / (t1 - t0) – Zac67 Jul 30 '23 at 14:06
-
@Zac67 How can I get a diff between two values at different time stamps in the same series of datain Grafana? Can it be done via the Transform option? – xis10z Jul 31 '23 at 08:19
-
I am unable to figure out how to get a delta/diff between two values in a query result? I guess it's via Transform but there is no way to get a t0 and t1 for the same seres of data. – xis10z Jul 31 '23 at 09:55
-
@Zac67 any thoughts on how to implement your suggestion? – xis10z Aug 02 '23 at 18:50
-
I'd guess you just set that data source to diff type, but I don't know the first thing about Grafana or I would have posted an answer. – Zac67 Aug 02 '23 at 18:53
-
Im unsure but mrtg had some nice tools to scan the target to fetch all kind of snmp mibs, just try them first? – djdomi Aug 03 '23 at 15:24
-
@Zac67 your original solution worked to capture interface bandwidth. Thanks! I was able to figure out the diff using "non-negative derivative" in Grafana. – xis10z Aug 04 '23 at 20:02
-
please share the output of your solution as an answer please – djdomi Aug 05 '23 at 07:32

