I have a file like
# HELP process_cpu_user_seconds_total Total user CPU time spent in seconds.
# TYPE process_cpu_user_seconds_total counter
process_cpu_user_seconds_total{NODE_APP_INSTANCE="undefined",instance="127.0.0.1:9091",job="my_server"} 3.938 1689042066
# HELP process_cpu_system_seconds_total Total system CPU time spent in seconds.
# TYPE process_cpu_system_seconds_total counter
process_cpu_system_seconds_total{NODE_APP_INSTANCE="undefined",instance="127.0.0.1:9091",job="my_server"} 0.593 1689042066
# HELP nodejs_gc_duration_seconds Garbage collection duration by kind, one of major, minor, incremental or weaken.
# TYPE nodejs_gc_duration_seconds histogram
nodejs_gc_duration_seconds_bucket{le="0.001",kind="minor",NODE_APP_INSTANCE="undefined",instance="127.0.0.1:9091",job="my_server"} 8 1689042066
# EOF
I use promtool tsdb create-blocks-from openmetrics ./the.prom ./data to push this metrics into tsdb,
result is
BLOCK ULID                  MIN TIME       MAX TIME       DURATION     NUM SAMPLES  NUM CHUNKS   NUM SERIES   SIZE
01H51E3HM7YJ90DJ72THJ20QX2  1689042066000  1689042066001  1ms          3            3            3            1419
and i copy the data to the prometheus data.
and i can use promtool tsdb dump to see that my metrics is in the tsdb file
{NODE_APP_INSTANCE="undefined", __name__="nodejs_gc_duration_seconds_bucket", instance="localhost:9091", job="my_server", kind="minor", le="0.001"} 8 1689042066000
{NODE_APP_INSTANCE="undefined", __name__="process_cpu_system_seconds_total", instance="localhost:9091", job="my_server"} 0.593 1689042066000
{NODE_APP_INSTANCE="undefined", __name__="process_cpu_user_seconds_total", instance="localhost:9091", job="my_server"} 3.938 1689042066000
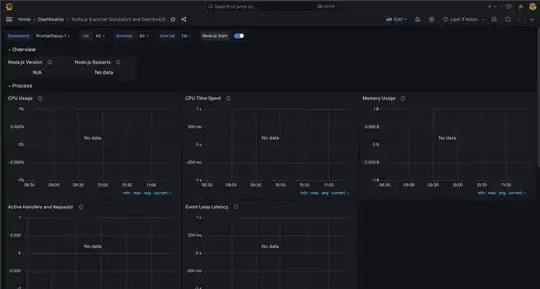
but i cannot search this metrics in prometheus and grafana. how to make it work?

