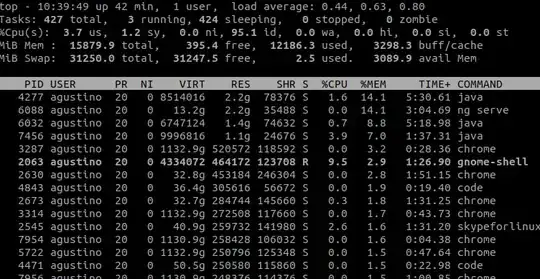
I have always used to interprete the "g" in top output to be size in Gigabytes even though the convention is to use uppercase "G" but now I am having second thoughts.
It's gigabytes. The procps-ng developers expect the user to choose between upper- and lower-case at compile time. Really.
I was monitoring my system memory usage when I found chrome using up to 1132.9g under VIRT column - an imposible amount of memory for the resources I have in my computer.
VIRT has no relationship with the resources you have in your computer. (Hence the name "virtual".) It represents virtual memory address space, and each region of virtual address space may be backed by actual RAM, but it may also be backed by something else – such as memory-mapped files, or nothing at all (a "fresh" RAM-backed anonymous mapping is not all reserved upfront; it only begins consuming RAM as it's dirtied).
In the case of web browsers, Chrome in particular, massive empty mappings may be used for JavaScript hardening similar to WebKit's GigaCage which Chrome also implements. As long as the mapping stays mostly untouched, it also mostly doesn't occupy any RAM – aside from a few kB or MB for the page table entries. (VSCode counts as a "web browser" here, as its Electron runtime is literally Chrome, and even "ng serve" – i.e. Node.js – uses the same JavaScript "V8" engine as Chrome does.) Finally for the GNOME Shell process, I suspect it's something to do with GPU VRAM access, although I'm not quite sure.
tl;dr you are looking at the wrong column. Just because it happens to count megabytes doesn't mean it's system memory usage.
