I need LBMs on Google Cloud Platform of metric type "Distribution" to make time series charts with values like counts or duration for many labels in one go.
Example: for 10 different steps in the data workflow counts and duration of the day are logged in a dictionary and logged as jsonPayload using gcloud logging's log_struct().
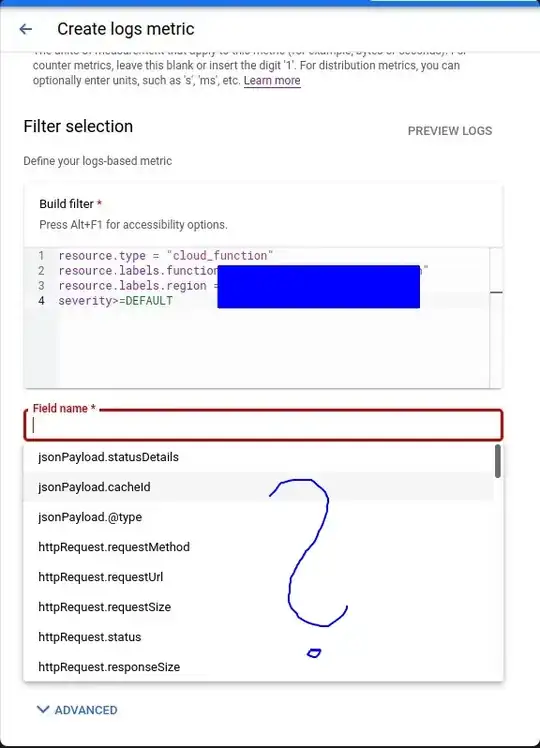
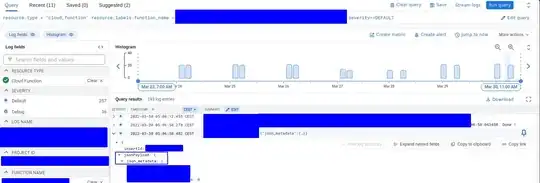
Although I see logged events when looking at a month in the Logs Explorer, I cannot choose any of the jsonPayload items in the drop-down menu to create the needed Log-Based Metrics (LBM) from it so that I can choose them in Graphana to show graphs.
In this drop-down menu, I was expecting my key-value pairs that I logged during the run of a cloud function, but I cannot choose anything that was logged, I only see other jsonPayload system entries. This is how the logs look like.
Side-note: I save the jsonPayload with a middle branch in that the children are under one middle branch in the drop-down, for example jsonPayload.json_metadata.rows_count and not jsonPayload.rows_count. That makes it clearer what is coming from the Python logging. I do not think that this is a problem, but you never know. I cannot find this middle branch and its children in the drop-down menu so that I cannot make the needed LBMs. How to get a full drop-down menu for the "Field name"?


