I have a Linode server that has been under load for a few hours. The configuration is 2 CPU Cores, 4GB memory, 80GB SSD storage mounted as 1 partition, 500MB swap. There's a second hard drive of 30GB which is also SSD. Software is Ubuntu 18.04, Apache 2.4.52, PHP-FPM (Most sites using 8.0, some on 7.2 and 8.1). I'm also using fail2ban and iptables for protection.
Here's the graph that Linode's dashboard shows me
Earlier I was getting spikes in network which corresponded to spikes in CPU usage. It was enough to make the websites on the server not respond (500 error) during the spikes. Now, I have constantly higher than usual disk IO.
Linode has a built in DDoS protection and I asked them about it and they said it didn't trigger any actions from DDoS protection layer. Does this look like an attack?
I've tried several commands but none of them has given me any clues so far.
iostat
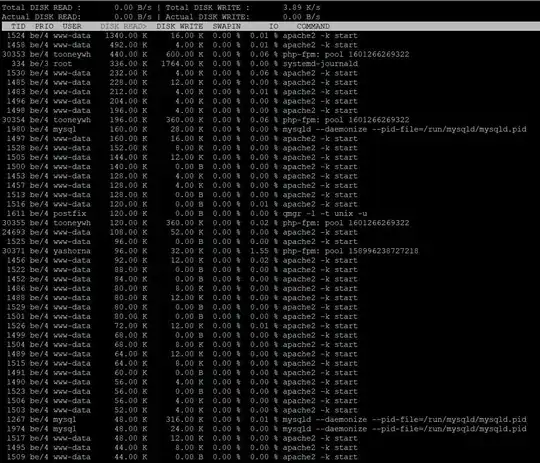
iotop -a :
vmstat 1 10
top : Again there's no process constantly on the list


