2

We were hitting the upper limits of our IOPs the last several days. We provisioned more IOPS a few times. 1250 -> 2500 -> 4500. Each Step we quickly saw we were using all the available IOPS as it would max out between the reads and writes.

Finally this morning we had another large customer onboard and our CPU, Memory, and IOPS maxed out. I made the decision to provisoin a larger database type to keep the system running. We went from db.m5.xlarge to db.m5.2xlarge. We also upped IOPs to 8000 with the upgrade.

Now our CPU is getting hammered in comparison, and our IOPS are practically 0. The app seems responsive but our task queues are quite slow.

No code has changed, just the database. What am I missing? Is RDS not reporting correctly?

last 3 hours

last 3 days

You'll notice the jumps in read IOPS in the last 3 days, those coorilate with the higher IOPS provisions.

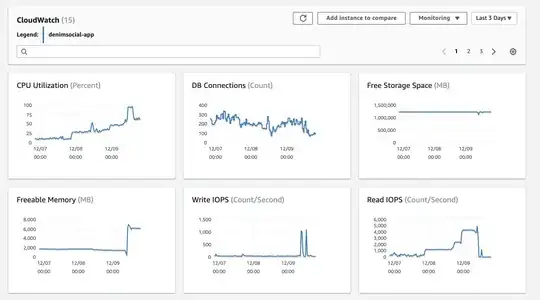
  • So I think I'm just an idiot. My theory, all of our data is in memory, so IOPS aren't even needed under normal load. Can anyone confirm? – MichaelWClark Dec 10 '20 at 03:51
  • Additional information request and we can confirm your data is primarily in memory. Any SSD or NVME devices on MySQL Host server? Post on pastebin.com and share the links. From your SSH login root, Text results of: B) SHOW GLOBAL STATUS; after minimum 24 hours UPTIME C) SHOW GLOBAL VARIABLES; D) SHOW FULL PROCESSLIST; E) STATUS; F) SHOW ENGINE INNODB STATUS; G) SELECT name, count FROM information_schema.innodb_metrics ORDER BY name; for server workload tuning analysis to provide suggestions. – Wilson Hauck Dec 12 '20 at 22:02

2 Answers2

1

You probably have a query that fell off a cliff. (Thanks for the good description. Here's the likely explanation.)

An example. Let's say a query is scanning a 7GB table (without a useful index, etc) with 70M rows.

Case 1: RAM = 8GB; innodb_buffer_pool_size = 6GB. The query bumps everything out of cache to finish the scan. This takes solid I/O. All other queries are also impacted -- their data was bumped out of RAM, too.

Case 2: RAM = 16GB; innodb_buffer_pool_size = 12GB. The first scan loads the entire table in cache; subsequent runs of that query don't need to do any I/O. Even the other queries run faster because of the lack of contention for the cache.

In both cases, there is probably a bunch of CPU chewed up in looking at all 70M rows.

Plan A: Spend money on having more RAM, and CPU and unneeded IOPs.

Plan B: Find that very naughty query and get us to help optimize it. Then you can go back to a cheaper VM.

Please provide the query and SHOW CREATE TABLE for the table(s) involved. The solution may be as simple as adding a composite index or reformulating the query.

Rick James
  • 2,463
  • 1
  • 6
  • 13
0

The key here was to do nothing at all. 'Magically' our CPU normalized to where I expected. The good news was I identified several sore spots in our queries, a few overzealous locks, and A TON of understanding about tuning InnoDB/RDS/MySQL.

Perhaps RDS was slowly optimizing indexes or something I don't fully understand, but now our latency is amazing, throughput and usage exactly where I'd expect with 4 more cores and 2x memory.

CPU Normalized

  • Congratulations on your current stability. Our offer to provide workload analysis on Dec 12, 2020 at 22:02 is still available for additional performance gains. Consider providing the additional information requested. – Wilson Hauck Dec 17 '20 at 15:04