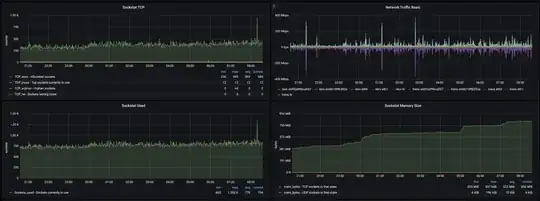
We are running a medium size AWS EKS cluster (~120 kubelet nodes) running mostly Go services. The services deployed in the cluster are quite busy, handling millions of calls per hour. Each kubelet runs on the same version of the standard Amazon Linux
Linux 4.14.203-156.332.amzn2.x86_64 #1 SMP Fri Oct 30 19:19:33 UTC 2020 x86_64 x86_64 x86_64 GNU/Linux
Some time ago we had noticed in our Grafana dashboards that on each kubelet node TCP mem (bytes) steadily grows over time without ever dropping.
We managed to pin this issue to a single, but a rather "large" (in terms of the size of the codebase) Go service. We now recycle this service regularly whilst looking for the cause of the leak.
I'm now starting to question if I understand this issue correctly from the host i.e. Linux Kernel PoV and would like to avoid following a mirage.
My understanding as of now is, the TCP memory bytes leak can be either on the receiving or sending side of things. I suspect these are bytes allocated for a socket (somewhere in Kernel) which remains open indefinitely with the data being queued somewhere without being "drained". Is this correct or am I fooling myself here?
If it is, is there a way I can inspect the data somehow? By "inspecting" I mean find the sockets holding this data.
Chasing open sockets by running lsof on the host side of things has now led to many leads I could follow up on, but one thing I have noticed is, there are a lot of sockets "inside" the service Pod in TIME_WAIT state, which I believe should not be much of a concern, though just to make sure I'm not missing anything I did drop the tcp fin_timeout to much lower value than what the default settings were (60s -> 10s) to recycle sockets faster.
Now, I understand this is our service leaking the memory, but I'm looking for some answers about the following questions:
- is my thinking about this problem from the Kernel PoV correct i.e. would the open sockets/FDs which havent got their buffers cleared (read/write) be the cause of this?
- if the answer to the above is yes, is there any way to tell, on the busy server, or to pinpoint which of these sockets have the buffers allocated but not cleared and on which end (send/recv)
Thanks
