The most probable cause that the following error is showing:
- "Does not have minimum availability”
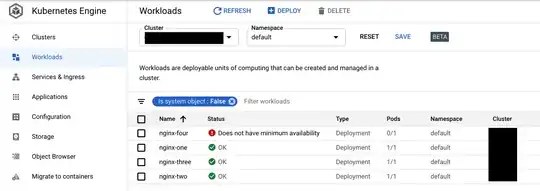
Is that there are some objects (like Pods) not allocated inside of the cluster.
There are some links referencing the same message:
Focusing specifically on the example showed in the question.
The setup is following:
- 1
GKE node with: 1 vCPU and 3.75 GB of RAM
The resources scheduled onto this single node cluster:
- 4
Deployments where each have following fields:
        resources:
          requests: # <-- IMPORTANT
            cpu: "100m" # <-- IMPORTANT
            memory: "128Mi"
          limits:
            cpu: "100m"
            memory: "128Mi"
For an example I tried to replicate setup as close as possible to the one in the question:
NAME                           READY   STATUS    RESTARTS   AGE
nginx-four-99d88fccb-v664b     0/1     Pending   0          51m
nginx-one-8584c66446-rcw4p     1/1     Running   0          53m
nginx-three-5bcb988986-jp22f   1/1     Running   0          51m
nginx-two-6c9545d7d4-mrpw6     1/1     Running   0          52m
As you can see there is a Pod that is in Pending state. Further investigation implies:
$ kubectl describe pod/nginx-four-99d88fccb-v664b
A lot of information will show about the Pod but the part that needs to be checked is Events:
Events:
  Type     Reason            Age                From               Message
  ----     ------            ----               ----               -------
  Warning  FailedScheduling  56m (x2 over 56m)  default-scheduler  0/1 nodes are available: 1 Insufficient cpu.
  Normal   Scheduled         56m                default-scheduler  Successfully assigned default/nginx-two-6c9545d7d4-mrpw6 to gke-gke-old-default-pool-641f10b7-36qb
  Normal   Pulling           56m                kubelet            Pulling image "nginx"
  Normal   Pulled            56m                kubelet            Successfully pulled image "nginx"
  Normal   Created           56m                kubelet            Created container nginx
  Normal   Started           56m                kubelet            Started container nginx
As you can see from above output:
FailedScheduling: ... 0/1 nodes are available: 1 Insufficient cpu
As posted in the question:
I keep getting not having enough cpu availability even the node is using only 9% cpu at the same time.
This CPU availability is strictly connected to the Allocated resources. You can have CPU usage in the midst of 10% and still run into Insufficient CPU messages. Here is why:
When you create a Pod, the Kubernetes scheduler selects a node for the Pod to run on. Each node has a maximum capacity for each of the resource types: the amount of CPU and memory it can provide for Pods. The scheduler ensures that, for each resource type, the sum of the resource requests of the scheduled Containers is less than the capacity of the node. Note that although actual memory or CPU resource usage on nodes is very low, the scheduler still refuses to place a Pod on a node if the capacity check fails. This protects against a resource shortage on a node when resource usage later increases, for example, during a daily peak in request rate.
-- Kubernetes.io: Docs: Concepts: Configuration: Manage resources containers: How pods with resource requests are scheduled
Take a look on the resources.requests section in the part of Deployment I included earlier. It is specified there that each Pod in the Deployment want a guarantee that 100m of CPU time will be available in the cluster. 4x100m = 400m.
If you run (after applying the workload):
Allocated resources:
  (Total limits may be over 100 percent, i.e., overcommitted.)
  Resource                      Requests          Limits
  --------                      --------          ------
  cpu                          -->939m (99%)<--     501m (53%)
  memory                        1081Mi (40%)      1721Mi (65%)
  ephemeral-storage             0 (0%)            0 (0%)
  hugepages-2Mi                 0 (0%)            0 (0%)
  attachable-volumes-gce-pd     0                 0
There is already allocated the 939M CPU from a 1000M (3/4 Pods are scheduled). That's why one of the Pod cannot be scheduled (even when the CPU usage is 10%).
A side note!
This would be specific to each and every cluster but this one reported 639m of CPU requested before any workload was scheduled.
To fix that you can either:
- Change the
.resources.requests section
- Use VPA to recommend the
requests and limits
- Use different node type
- Enable autoscaling
Additional resources:
