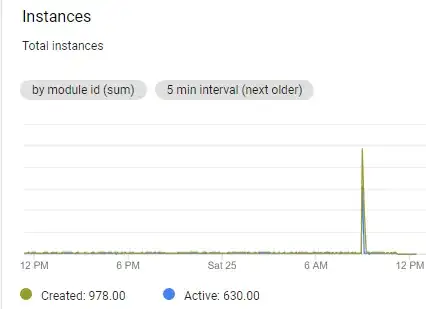
After a few days of using an App Engine to stream data from Unity to PubSub I've encountered huge amount of 502 errors which increased the number of created instances and because of that it goes over Daily spending limit.
Instance increase
Python script I'm using: https://github.com/GoogleCloudPlatform/python-docs-samples/tree/master/appengine/standard_python37/pubsub
All the errors are HTTP POST requests and have latency bigger that 30s and the log message is:
This request caused a new process to be started for your application, and thus caused your application code to be loaded for the first time. This request may thus take longer and use more CPU than a typical request for your application.
I've been recommended to look into readiness checks and liveness checks which are only available on Flex environment but not on Standard. What could cause this errors and how to avoid them?
Log example:
    {
 httpRequest: {
  status: 502
 }
 insertId: "5e2bf548000bc56fe5d27eec"
 labels: {
  clone_id: "00c61b117c17d8ad1566cc1788d5763552dbe5ace0c77a3523e4047bdc431b306a3840a5168f"
 }
 logName: "projects/x/logs/appengine.googleapis.com%2Frequest_log"
 operation: {
  first: true
  id: "5e2bf52700ff069deff4c6f3400001737e626f6f74796661726d6c697665000133000100"
  last: true
  producer: "appengine.googleapis.com/request_id"
 }
 protoPayload: {
  @type: "type.googleapis.com/google.appengine.logging.v1.RequestLog"
  appEngineRelease: "1.9.71"
  appId: "s~x"
  cost: 3.2186e-8
  endTime: "2020-01-25T07:59:04.771274Z"
  finished: true
  first: true
  host: "x.appspot.com"
  httpVersion: "HTTP/1.1"
  instanceId: "00c61b117c17d8ad1566cc1788d5763552dbe5ace0c77a3523e4047bdc431b306a3840a5168f"
  instanceIndex: -1
  ip: "x"
  latency: "33.337627s"
  line: [
   0: {
    logMessage: "This request caused a new process to be started for your application, and thus caused your application code to be loaded for the first time. This request may thus take longer and use more CPU than a typical request for your application."
    severity: "INFO"
    time: "2020-01-25T07:59:04.770902Z"
   }
  ]
  megaCycles: "4387"
  method: "POST"
  pendingTime: "0.005315345s"
  requestId: "5e2bf52700ff069deff4c6f3400001737e626f6f74796661726d6c697665000133000100"
  resource: "/"
  responseSize: "288"
  startTime: "2020-01-25T07:58:31.433647Z"
  status: 502
  traceId: "2ee7b458fad62565bd5ed150e67647fc"
  traceSampled: true
  urlMapEntry: "auto"
  userAgent: "Dalvik/2.1.0 (Linux; U; Android 5.1.1; SM-T360 Build/LMY47X) x SDK"
  versionId: "3"
  wasLoadingRequest: true
 }
 receiveTimestamp: "2020-01-25T07:59:04.772448343Z"
 resource: {
  labels: {
   module_id: "default"
   project_id: "x"
   version_id: "3"
   zone: "us12"
  }
  type: "gae_app"
 }
 severity: "INFO"
 timestamp: "2020-01-25T07:58:31.433647Z"
 trace: "projects/x/traces/2ee7b458fad62565bd5ed150e67647fc"
 traceSampled: true
}
App.yaml:
runtime: python37
entrypoint: gunicorn -b :$PORT main:app

    #[START env]

        env_variables:
            PUBSUB_TOPIC: xx
            # This token is used to verify that requests originate from your
            # application. It can be any sufficiently random string.
            PUBSUB_VERIFICATION_TOKEN: xx
        #[END env]
Requirements.txt:
Flask==1.0.2
google-api-python-client==1.7.8
google-auth==1.6.3
google-cloud-pubsub==0.40.0
gunicorn==19.7.1
*Note: After a few days the increased number of instances is not visible on AppEngine dashboard even though the errors are still visible in the logs.